 |
|
||||||||
|
|
| Home |
Volume 5: No. 3, July 2008
Suggested citation for this article: Holt JB, Mokdad AH, Ford ES, Simoes EJ, Bartoli WP, Mensah GA. Use of BRFSS data and GIS technology for rapid public health response during natural disasters. Prev Chronic Dis 2008;5(3).
http://www.cdc.gov/pcd/issues/2008/
jul/07_0159.htm. Accessed [date].
Having information about preexisting chronic diseases and available public health assets is critical to ensuring an adequate public health response to natural disasters and acts of terrorism. We describe a method to derive this information using a combination of data from the Behavioral Risk Factor Surveillance System and geographic information systems (GIS) technology. Our demonstration focuses on counties in states that are within 100 miles of the Gulf of Mexico and the Atlantic Ocean coastlines. To illustrate the flexible nature of planning made possible through the interactive use of a GIS, we use a hypothetical scenario of a hurricane making landfall in Myrtle Beach, South Carolina.
The aftermaths of recent natural disasters have highlighted the catastrophic social, economic, and public health impact that these events can have. In December 2004, the Indian Ocean tsunami killed 226,408 people, rendered 1,033,464 homeless, adversely affected an additional 1,356,339, and cost an estimated $7,710,800,000 in damage (1). Between July and October 2005, hurricanes Dennis, Katrina, Rita, and Wilma resulted in the deaths of 1852 people and affected 830,000 more, many of whom became homeless (2).
Although much attention rightly has been given to the immediate safety and acute health needs of these people (3-6), less emphasis has been devoted to the needs, both immediate and long-term, of people with preexisting health conditions. Often, the magnitude of the public health impact is determined by the underlying vulnerabilities of the affected population, including people with chronic diseases, pregnant women, and children, and by the extent of damage to the local public health infrastructure. The public health assets of surrounding communities, which could be used to mitigate damage and provide service to evacuees, also play important roles. Lessons learned from recent disasters suggest that prospective assessment of existing health problems and available resources is essential for effective preparedness and response. Unfortunately, these data are not readily available for most communities at risk.
Hurricane Katrina, which devastated the third most populated metropolitan area on the U.S. Gulf Coast, taught us that this prospective assessment is essential (7). Interruptions in treatment brought on by a disaster increase the risk of death or serious complications for people who require insulin to control their diabetes, for heart attack survivors who take daily clot-preventing medications, for people with severe chronic lung disease who require home oxygen therapy, and for people with kidney failure who are treated with outpatient hemodialysis. Natural disasters often interfere with or totally disrupt the availability of supplemental oxygen supplies. Power outages prevent the use of dialysis and other medical equipment and can exacerbate existing health conditions by preventing the cooling or heating that patients require. Conditions of extreme heat and cold are particularly dangerous for elderly people, pregnant women and their fetuses, neonates, and young children. Lastly, chronic diseases are often aggravated by the lack of food and clean water and the increased levels of physical and mental stress that accompany a disaster (7).
To effectively plan a response to natural disasters, such as hurricanes, floods, and earthquakes, and man-made disasters, such as acts of terrorism, public health officials and first responders need analytic methods to quickly estimate the number of people who will be affected and the subpopulations that are at particular risk. Equally as important is the ability to locate and quantify facilities such as hospitals and schools that are needed during a response. Given the complexity and the sometimes lengthy lead times required for state and local health officials to prepare personnel, facilities, and medical supplies for a public health response, establishing a baseline dataset in advance of a disaster is vital. Preferably, this dataset would be updated frequently and would have the analytic tools needed to model contingencies and develop effective responses, including estimates of the required quantities of essential maintenance medication and treatment for patients with chronic diseases (7).
In the wake of the 2005 hurricanes, Mokdad et al (7) addressed the need for a surveillance tool to support disaster response planning that gives appropriate consideration to people with chronic diseases and other vulnerable populations. Recommendations were that the surveillance tool should have three components: 1) a means of determining the baseline magnitude of the disaster and needs of these vulnerable people, 2) a means of assessing needs and levels of response in an affected area during a disaster, and 3) a means of monitoring the long-term effects of a disaster.
In response to these recommendations, we demonstrate how the Behavioral Risk Factor Surveillance System (BRFSS) and geographic information system (GIS) technology available from Centers for Disease Control and Prevention’s (CDC’s) National Center for Chronic Disease Prevention and Health Promotion can be combined to meet the need for rapid assessment of subpopulations at risk and to identify available resources in advance of a disaster. We also note the value of the BRFSS in addressing the second and third components of the recommended surveillance tool.
We used data from the BRFSS (8-11) to estimate the prevalence of health risk factors and chronic diseases, the 2000 U.S. census (Summary Tape File 3 [SF-3] Long Form) (12) to obtain a sociodemographic baseline, and the American Hospital Association Annual Survey Database to quantify hospital resources (13). Environmental Systems Research Institute, Inc (ESRI) provided data on school locations and attributes by collating data from the U.S. Geographic Names Information System and the U.S. Board of Geographical Names, both of which collect and archive data on civic institutions as part of the U.S. Geological Survey’s National Map program (14).
The BRFSS, operated by state health departments with assistance from CDC, collects data on many of the behaviors and conditions associated with the leading causes of morbidity and mortality in the United States. Each month, trained interviewers use an independent probability sample of households with telephones to collect data from the noninstitutionalized population aged 18 years or older. A detailed description of the survey methods is available elsewhere (15). All questionnaires are available online (www.cdc.gov/brfss/questionnaires). We used data from the District of Columbia and the 21 states whose land area partially or completely extends to within 100 miles of the Gulf of Mexico and the Atlantic Ocean coastlines. To ensure that each county-level prevalence estimate was based on a combined sample of at least 50 responses, we combined data from survey years 2001, 2003, 2004, and 2005 (N = 904,531).
BRFSS respondents for the years that we used answered questions pertaining to high blood pressure, use of blood pressure medication, high blood cholesterol, heart attack, heart disease, stroke, diabetes, asthma, and pregnancy. From the answers, we estimated the prevalence of these medical conditions for the general population. We used SAS 9.1.3 (SAS Institute Inc, Cary, North Carolina) and the proc surveymeans design statement to account for the complex sampling design of the BRFSS.
GIS technology has been defined in various ways (16,17), but for succinctness we prefer the definition of Lo and Yeung: “a set of computer-based systems for managing geographic data and using these data to solve spatial problems” (18). For our demonstration, we used ArcGIS 9.2 (Environmental Systems Research Institute, Inc, Redlands, California), which enabled us to merge, analyze, and display data and results in one software application. We obtained GIS shapefiles (i.e., geographic boundary files) of U.S. states and counties (hereafter, counties refers to counties and county-equivalents: parishes in Louisiana and independent cities in Virginia) from ESRI, and extracted the coastlines of the Atlantic Ocean and the Gulf of Mexico through GIS-assisted manual editing. The resulting coastline shapefile became the baseline from which we constructed 50- and 100-mile buffers. We chose these radii arbitrarily, as reasonably good markers for the differences in area damage that result from hurricanes of various magnitudes.
To estimate the underlying populations at risk within the two buffer zones, we determined which counties the zones comprised. We mapped the population-weighted centroid (center of mass) of the District of Columbia and each county and conducted two spatial joins (a GIS overlay function) between population-weighted centroids and county shapefiles to extract those counties with centroids in both buffer zones (≤50 miles and >50–100 miles from the coastline) (Figure 1). We used population-weighted centroids, which are analogous to centers of gravity, rather than geometric centroids because population-weighted centroids more accurately reflect the spatial distribution and density of county populations.
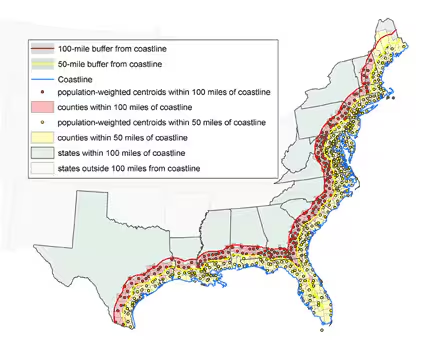
Figure 1. Counties with population-weighted centroids within 50- and 100-mile radius of Gulf of Mexico and Atlantic Ocean coastlines, 2000. Data from U.S. Census Bureau (12).
We imported county sociodemographic data from the 2000 U.S. census (19) into ArcGIS in database format and joined the database to the county shapefile, using county FIPS (Federal Information Processing Standards) codes as the primary join key. The National Institute of Standards and Technology issues a standardized set of numeric codes to ensure uniform identification of geographic entities by all federal government agencies (19,20). These data include variables on total population, age distribution, racial/ethnic distribution, housing units and occupancy status, median housing values, school enrollment by type of school, prevalence of disability by age group, median family income, and prevalence of poverty by age group. We also imported county public health data from the BRFSS into the GIS database. Once the data were joined to the county shapefiles, summary statistics and ratios of the individual variables were computed by area.
To demonstrate the usefulness of a GIS in a real-time emergency, we applied the technology to a hypothetical scenario in which a hurricane makes landfall in the vicinity of Myrtle Beach, South Carolina. We created a 100-mile buffer around the point location for the city of Myrtle Beach and used the GIS to extract those counties with population-weighted centroids within this buffer zone (Figure 2). All values for population demographics, people with chronic diseases, and resources for emergency response were contained within the extracted county-level geographic records in the GIS.
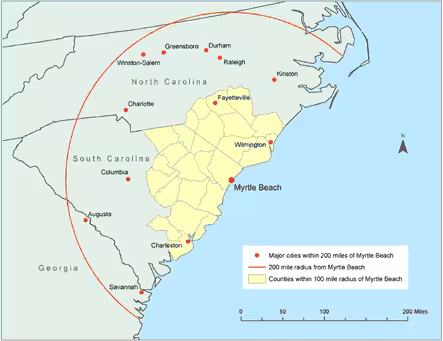
Figure 2. Counties with population-weighted centroids within a 100-mile radius and major cities within a 200-mile radius of Myrtle Beach, South Carolina, 2000. Data from U.S. Census Bureau (12).
According to the 2000 U.S. census, 139,441,051 people, or approximately 50% of the U.S. population at that time, lived in the total area included in our demonstration (i.e., 21 states and the District of Columbia) (12). Of these people, 66% lived in counties with population-weighted centroids within 100 miles of the Gulf of Mexico and Atlantic Ocean coastlines (57% within ≤50 miles, 9% from >50–100 miles). Note that in our assessment, data for the two coastal buffer zones overlap, so that data for the area in the 100-mile zone include data for the area in the 50-mile zone.
Our assessment shows that approximately 18.2 million people within 100 miles of the coastline were likely to be at particular risk in a disaster because of their age (either <5 years or ≥65 years); approximately 13.8 million, because of being school-aged (i.e., being enrolled in nursery school, kindergarten, or elementary school); and approximately 208,246, because of being inpatients in a hospital (estimated by multiplying the number of hospital beds by a 70% occupancy rate) (Table 1).
Data joined with the GIS provide the number of hospitals, hospital beds, and hospital workers in total and by state for each zone (Table 2) and the estimated number of people with selected medical conditions in total and by state for each zone (Table 3). By combining the information in Tables 2 and 3, health officials can compare the extent of chronic diseases and the availability of response resources in any coastal area. The number of hospitals in a local area varies greatly throughout each coastal zone, as does the number of beds in a single hospital (Figure 3). As would be expected, areas with large populations tend to have access to greater numbers of hospitals and hospital beds, but the ratio of people to hospitals and of people to hospital beds may actually be lower in highly populated urban areas. This reality underscores the importance of establishing baseline data on the at-risk population and the resources available to respond to surges in demand.
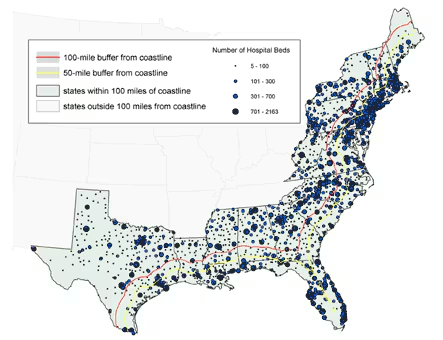
Figure 3. Locations of hospitals, with number of beds per hospital, in states with land area within 100 miles of the coastline. Data from the American Hospital Association (13).
For the Myrtle Beach scenario, an estimated 412,364 people would be at particular risk because of their age; 344,105, because of being in nursery, kindergarten, and elementary schools; and 4661, because of being inpatients in a hospital (Table 4). Given that 16% of people in the area live in poverty, many of these vulnerable people would have to rely on the government for evacuation.
The BRFSS can and has been used to assess needs and levels of response during a disaster and to monitor the long-term effects of a disaster. In response to the unexpected shortfall in the 2004–2005 supply of influenza vaccine, CDC and the Advisory Committee on Immunization Practices (ACIP) recommended prioritizing vaccination for people aged 65 years and older and for others at high risk (21,22). To monitor coverage, the BRFSS added several questions about influenza vaccination, including new questions on priority status and the month and year of vaccination among children and adults (23). Because of the rapid turnaround of BRFSS data, public health officials were able to obtain near–real-time estimates of influenza coverage (24), including county-level estimates based on small-area estimation procedures (25). One study, using data for the New Orleans–Metairie–Kenner, Louisiana, Metropolitan Statistical Area, demonstrated the feasibility of using the BRFSS to estimate baseline information on the number of older adults who may have a disability and thus need assistance in evacuating to shelters or who may need special equipment in the event of a natural disaster (26).
Flexibility is one of the most useful features of a GIS. By altering the planning assumptions that are entered into the GIS, public health officials can conduct analyses quickly and efficiently on any issue for which data are available. Sources could include the National Hospital Ambulatory Medical Care Survey, which has asked questions in the past that may yield data on hospital preparedness for natural disasters and acts of terrorism (27); state-based trauma system registries, which contain data on mass casualties and trauma (28); and CDC’s National Center for Health Statistics, which maintains data on the number of live birth deliveries by county, from which estimates can be derived of the number of pregnant women and neonates at a given time. The salient questions for health officials are: What sources of primary data are readily available? To what extent can the surge capacity of identified assets be ascertained reliably? How generalizable are the outputs, and how sensitive are they to the particular type of disaster?
The authors thank Dr Wayne Giles, MD, MS, Director, Division of Adult and Community Health, National Center for Chronic Disease Prevention and Health Promotion, CDC, for his support of the BRFSS and GIS technology.
Corresponding Author: James B. Holt, PhD, MPA, Centers for Disease Control and Prevention, 4770 Buford Hwy, NE, MS: K-67, Atlanta, GA 30341. Telephone: 770-488-5510. E-mail: [email protected].
Author Affiliations: Ali H. Mokdad, Earl S. Ford, Eduardo J. Simoes, George A. Mensah, Centers for Disease Control and Prevention, Atlanta, Georgia. William P. Bartoli, Northrop Grumman Information Technology, Atlanta, Georgia.
|
|
|
|
|
|
The findings and conclusions in this report are those of the authors and do not necessarily represent the official position of the Centers for Disease Control and Prevention.
Privacy Policy | Accessibility This page last reviewed March 30, 2012
|
|