|
|
||||||||
|
|
| Home |
Volume 8: No. 4, July 2011
Suggested citation for this article: Zhang Z, Zhang L, Penman A, May W. Using small-area estimation method to calculate county-level prevalence of obesity in Mississippi, 2007-2009. Prev Chronic Dis 2011;8(4):A85. http://www.cdc.gov/pcd/issues/2011/jul/10_0159.htm. Accessed [date].
PEER REVIEWED
Introduction
Obesity is one of Mississippi’s pressing public health problems.
Since 2005, the state
has ranked first in the nation in adult obesity prevalence. For authorities to
take targeted
action against the obesity epidemic, counties, regions, and subpopulations that
are most affected by obesity need to be identified. The
objective of this study was to assess the scope, socioeconomic and geographic characteristics, and temporal trends of the obesity epidemic in Mississippi.
Methods
Using 2007-2009 Mississippi Behavioral Risk Factor Surveillance System data and auxiliary data, we applied a small-area estimation method to estimate county-level obesity prevalence in 2007
through 2009, to assess the association between obesity and socioeconomic factors and to evaluate temporal trends. We determined geographic patterns by mapping
obesity prevalence. We appraised the precision of estimates by the width of 95%
confidence intervals, and we validated our small-area estimates by comparing them
with direct estimates.
Results
In 2009, the county prevalence of obesity ranged from 30.5% to 44.2%. Counties with the highest prevalence of obesity
were in the Delta region and along the Mississippi River. The obesity prevalence increased from 2007 through 2009. Age, sex, race, education, and employment status
were associated with obesity.
Conclusion
The 2009 obesity prevalence in all Mississippi counties was substantially higher than the national average and
differed by geography and race. Although urgent intervention measures are needed in the entire state, policies and programs giving higher priority to higher-risk areas and subpopulations identified by this study may be better strategies.
In the past 25 years, the prevalence of obesity, defined as a body mass index (BMI) of at least 30 kg/m2, has increased dramatically in the United States; more than one-third of adults are now obese (1-4). Mississippi has ranked first in the nation in obesity prevalence since 2005. Between 1995 and 2009, the prevalence of obesity in Mississippi increased substantially, from 19.5% to 35.4% (5), and there is no indication that this upward trend will level off soon. Obesity is associated with heart disease, diabetes, cancer, asthma, arthritis, stroke, and premature death (6,7). Consequently, obesity and its associated health problems have a substantial social and economic effect (6,8). According to the Mississippi State Department of Health (9), obesity is one of the state’s most pressing public health problems. The high and increasing rate of diabetes in the state is highly correlated with the increasing rate of obesity (9,10). The highest obesity rates should be identified for priority intervention both because of limited resources and because obesity control programs may be more effective when tailored according to specific community needs (11,12).
Socioeconomic characteristics, such as age, sex, race, income, and education, and community factors such as average per capita income and percentage of labor-intensive workers are associated with obesity (3,13). In an effort to establish the association of diabetes with obesity, Centers for Disease Control and Prevention (CDC) produced 2007 county-level obesity prevalence estimates for 3,141 US counties by using Bayesian multilevel modeling (10) but did not analyze geographic and socioeconomic characteristics of the obesity epidemic for the states. To our knowledge, no studies have focused on providing up-to-date small-area health statistics and related information in Mississippi for prevention and intervention purposes. In this study, we sought to produce reliable county-level estimates of obesity prevalence for all Mississippi counties, identify geographic heterogeneity and temporal trends, and evaluate associations between obesity and socioeconomic factors. This information would enable the development of appropriate obesity prevention policies and community interventions.
Established by CDC, the Behavioral Risk Factor Surveillance System (BRFSS) is an ongoing state-based surveillance system tracking health conditions and risk behaviors among noninstitutionalized adults aged 18 years or older in the United States. The design of BRFSS aims at generating reliable prevalence estimates at the state level or for large metropolitan statistical areas. Sample size for counties are usually too small for making direct inferences with satisfactory precision. CDC suggests that a sample size of at least 300 is necessary for direct estimation (14,15). To overcome the limitation of small sample sizes, we developed a 2-step estimation method. This method belongs to a family of small-area estimation techniques that includes varied approaches for making inferences about geographic or social subdomains of the survey domain. The power of the small-area estimation method resides on its ability to borrow strength from multiple sources of data — data collected at other times, or in related areas, or both to increase the effective sample size and thus achieve adequate precision. Among current small-area estimation methods, the Hierarchical Bayes approach and generalized linear mixed models have been primary choices (16-18). We used a generalized linear mixed model in this study. We incorporated a generalized linear mixed model and traditional synthetic methods to meet the small-area estimation needs in this study.
We acquired individual-level BRFSS data for Mississippi for 2007 through 2009. Variables included in the analytical dataset were self-reported height and weight and demographic and socioeconomic variables, including age, race, sex, education level, employment status, annual household income, and marital status. We used the Federal Information Processing Standard code as the location variable for county. We categorized BMI as a binary variable, obesity (obesity = 0 if BMI <30 kg/m2, obesity = 1 if BMI ≥30 kg/m2). In the original Mississippi BRFSS data, age is a continuous variable. Through initial exploratory data analysis, we found a quadratic relationship between BMI and age. According to the shape of the quadratic regression line, we categorized age into 4 groups: 18 to 29, 30 to 44, 45 to 64, and 65 years or older. We categorized education as less than a bachelor’s degree and bachelor’s degree or higher. For employment status, we grouped employed for wages and self-employed as “employed,” and grouped unemployed temporarily, those unable to work, students, retired people, and homemakers as “unemployed.”
The exclusion criteria were 1) missing Federal Information Processing Standard code information (n = 39); 2) missing BMI values or biologically unlikely BMI values (BMI <12 kg/m2 or BMI >70 kg/m2) (n = 1,013); 3) pregnant (n = 138); 4) races other than black and white (n = 383). Taking into consideration that in Mississippi 98.5% of the population belongs to 1 of 2 categories, black alone or combined and white alone or combined (19), we excluded the small portion (1.5%) of respondents of other races to facilitate small-area estimation. Respondents who chose black alone or black and other race(s) were categorized as black alone or combined; respondents who chose white alone or white with race(s) other than black were categorized as being in the white alone or combined category. The final analytical dataset of 2007-2009 BRFSS had 25,046 observations.
The data sources for auxiliary information were the 2000 US Census (19) and the US Department of Agriculture Economic Research Service (20). We used the auxiliary information to construct predictor variables for statistical modeling. Auxiliary covariates included county-specific sociodemographic factors such as county population composition of age, sex, race, educational achievement, county unemployment rate, rural-urban continuum characteristics, economic dependence indicators, and poverty indicator. Corresponding to the 4 age categories at the individual level, the auxiliary dataset included 4 age variables, which are the percentages of each age group 18 years or older in the county population.
Modified on the basis of the multilevel logistic regression model of Li and colleagues (13), our 2-step small-area estimation method is a combination of hierarchical modeling and synthetic estimation techniques. This mixed model produces a set of fixed-effect parameter estimates, which are general to all counties, and a set of random-effect parameter estimates, which are county-specific values. First, we identified the independent variables that were significantly associated with obesity by fitting a generalized linear mixed model with the relevant variables, both individual-level and county-level. We used backward elimination to prune the model. To further improve predictability, we set the selection criterion for retaining a variable or interaction term in the model at α = 0.1 (21). In the final model, fixed effects included the following variables: age, sex, race, education level, employment status, survey year, and county-level average per capita annual household income. Random effects included individual-level variables age, sex, race, education level, and survey year. We also calculated odds ratios for associated socioeconomic factors in this step.
In the second step of the estimation, we applied a synthetic technique to link the model-generated parameter estimates to the county-specific characteristics to produce county-level estimates. This way, the strength borrowed through the model is realized for each county. Because random effects were not significant, we used only the fixed-effect values in the calculation. However, following the recommendation of Binder (22), Jiang (23), and Jia et al (24), we kept the random-effects component in the model to improve estimation for fixed effects and to enhance the proper selection of variables (Appendix). We conducted all analyses by using SAS version 9.2 (SAS Institute Inc, Cary, North Carolina) to account for the complex sampling design. We grouped the county-level obesity prevalence estimates into quartiles to examine geographic patterns. We produced the obesity map by using ArcGIS 9.2 (ESRI, Redlands, California).
We assessed the precision of our estimates by using the width of 95% confidence intervals (CIs). Following the example of another study (25), we examined correlations and mean absolute differences between model estimates and internal standards: direct estimates of the state-level obesity rate for 2007 through 2009, and direct estimates for age, sex, and race subgroups. The sample sizes for the 4 age subgroups, 2 sex subgroups, and 2 race subgroups were large enough for reliable direct estimation (range, 663-7,305). Taking into consideration the complex sampling design of BRFSS, we used SAS PROC SURVEYLOGISTIC procedure (SAS Institute, Inc, Cary, North Carolina) for direct estimations to account for the weight of each respondent.
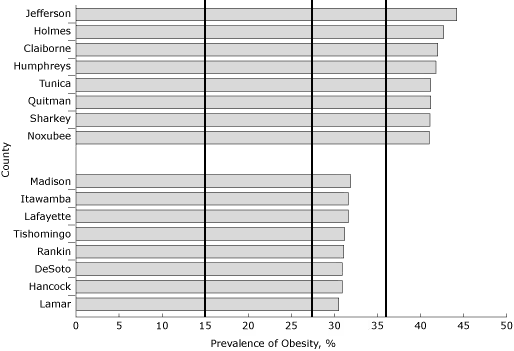
The state obesity prevalence increased significantly, from 32.5% in 2007 to 33.4% in 2008 and 35.4% in 2009. The prevalence estimates of all 82 counties were higher in 2009 than in 2007 (Tables 1 and 2). In 2009, all counties had prevalence of obesity greater than 30%. In 49 counties, the prevalence of obesity was at 35% or higher, and in 12 counties, was at least 40% or higher. Compared with the Healthy People 2010 goal and with the 2009 national average, all of the county estimates were substantially higher (Figure 1).
Figure 1. 2009 Mississippi County prevalence of obesity, Behavioral Risk Factor Surveillance System (BRFSS) data. Ten percent of the counties with the lowest and highest obesity rates are shown. The vertical line at 15% indicates the Healthy People 2010 goal for obesity; vertical lines at 27.1%, and 35.4% indicate the 2009 national and state averages, respectively. Obesity is defined as a BMI ≥30.0 kg/m2 based on 2009 BRFSS self-reported data. [A tabular version of this figure is also available.]
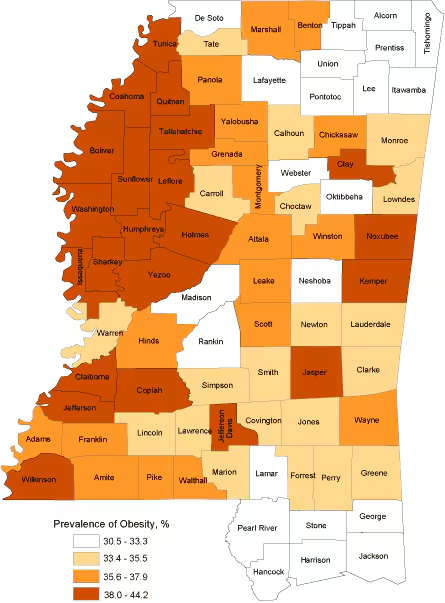
There was considerable geographic variation in obesity prevalence among Mississippi counties. The difference between Jefferson County (highest) and Lamar County (lowest) was 13.7% (Figure 2). Counties with higher obesity rates were clustered in the Mississippi Delta region and along the Mississippi River (Figure 2). Counties along the coastline and in the northeast region (Appalachian foothills) had lower obesity rates, as did counties with higher socioeconomic status, such as Madison and Rankin counties.
Figure 2. 2009 Mississippi county prevalence of obesity map (in quartiles), Behavioral Risk Factor Surveillance System (BRFSS) data. Lighter colors represent lower obesity rate, and darker colors represent higher obesity rate. Obesity is defined as BMI ≥30.0 kg/m2 based on 2009 BRFSS self-reported data. [A tabular version of this figure is also available.]
Respondents aged 30 to 44 years had the highest odds of being obese (Table 3). Compared with college graduates, respondents with an education level less than a bachelor’s degree were more likely to be obese. Women had slightly higher odds than men, and blacks had much higher odds than whites. The interaction between sex and race was significant (P <.001); compared with white men, the odds of obesity were 2.2 (95% CI, 2.0-2.5) for black women, 1.4 (95% CI, 1.2-1.6) for black men, and 0.8 (95% CI, 0.7-0.9) for white women.
The width of 95% CIs for all county estimates was less than 5 percentage points (range 2.5-4.7 percentage points). This precision was comparable to that of the design-based direct estimates for the state and is considered reliable (25,26). To assess accuracy, we aggregated small-area county-level estimates to the state level for 2007 through 2009 and compared them with their respective state-level direct estimates; we also compared state-level model estimates with state-level direct estimates for 2007 through 2009. We further compared model estimates of age, sex, and race subgroups with their respective direct estimates. Pearson’s correlation coefficients between the 2 sets of estimates for the comparisons were 0.95, 0.95, and 0.96, respectively, and the mean absolute differences were 0.5%, 0.5%, and 1.5%, respectively.
Using 2007-2009 BRFSS data, we obtained stable estimates for county-level prevalence of obesity. The 2009 obesity prevalence in all Mississippi counties is high: it shows the size and scope of the problem facing the state. This finding may help raise the awareness of the obesity crisis for state policy makers, health agency officials, journalists, and the general public. The county estimates also show that obesity prevalence among Mississippi counties varies considerably, which reveals the heterogeneous nature of the obesity epidemic in the state and requires targeted prevention measures to curb the trend. Furthermore, the escalating trend observed in Mississippi necessitates aggressive action. Mississippi has taken firm steps in confronting the child obesity crisis (27); parallel measures should be taken for adults.
Similar to observations reported by Li and colleagues (13), we found that in general, socioeconomic status was inversely related to the county prevalence of obesity among adults aged 18 years or older in Mississippi, after adjusting for age, sex, and race. This information may be helpful in guiding the direction of obesity prevention campaigns.
Confirming the troubling racial and socioeconomic disparities in obesity rates observed in other studies (2,3,28), our study shows that the risk of obesity for blacks nearly doubled that of whites, and black women had the highest odds of obesity. The 2000 Census indicates that Mississippi’s population consists of 33.7% blacks, the highest in the nation (19). This means that compared with the rest of the nation, a larger proportion of Mississippi’s population is in a higher risk category. Therefore, racial disparity in obesity affects Mississippi more than other states. The racial disparity, along with socioeconomic disparities, may influence public health efforts to plan and implement tailored prevention policies and programs because the effectiveness of health-promoting strategies varies among racial and socioeconomic groups. For instance, walking trails may be more effective in a community where a certain ethnic group clusters, and a farmer’s market may be more effective in another community of different racial combinations. Consequently, prevention polices and programs would be most effective if designed accordingly.
This study has potential biases and limitations. First, because the weight and height values in BRFSS were self-reported, bias may have occurred (29,30). Compared with other surveys that generate estimates of obesity prevalence (eg, the National Health and Nutrition Examination Survey, for which trained professionals measure the height and weight of participants), BRFSS data tend to underestimate obesity prevalence. Some similar studies, attempting to minimize self-reporting bias, developed a correction method by using auxiliary data (13). However, since self-reporting bias affects all the county-level estimates similarly, it is not expected that relative distribution of obesity would vary. When estimates are biased, concerns arise about the magnitude of the bias. In the absence of an external standard against which to compare our data, our assessment of accuracy in this study is limited. Second, because of software limitations in handling standard error estimation when using mixed models for complex sample survey data, the 95% CI produced was a reasonable approximation, not exact. Further investigation in this direction may be needed.
We thank Ron McAnally and Dick Johnson of the Mississippi State Department of Health for providing Mississippi BRFSS data. We also thank Nimish Valvi of the Mississippi State Department of Health for mapping the county obesity rates.
Corresponding Author: Zhen Zhang, PhD, Center of Biostatistics and Bioinformatics, University of Mississippi Medical Center, 2500 N State St, Jackson, MS 39216. Telephone: 601-715-2125. E-mail: [email protected].
Author Affiliations: Lei Zhang, Mississippi State Department of Health, Jackson, Mississippi; Alan Penman, Warren May, University of Mississippi Medical Center, Jackson, Mississippi.
|
|
|
|
|
|
The findings and conclusions in this report are those of the authors and do not necessarily represent the official position of the Centers for Disease Control and Prevention.
Privacy Policy | Accessibility This page last reviewed March 30, 2012
|
|