|
|
||||||||
|
|
| Home |
Volume 4: No. 2, April 2007
Suggested citation for this article: Albertorio-Diaz JR, Notzon FC, Rodriguez-Lainz
A. Diabetes hospitalization at the U.S.–Mexico border. Prev Chronic Dis [serial
online] 2007 Apr [date cited]. Available from: http://www.cdc.gov/pcd/issues/2007/
apr/06_0073.htm.
PEER REVIEWED
Introduction
The diabetes hospitalization rate for the region along the U.S. side of the U.S.–Mexico border is unknown, a situation that could limit the success of the Healthy Border 2010 program. To remedy this problem, we analyzed and compared hospital discharge data for Arizona, California,
and Texas for the year 2000 and calculated the diabetes hospitalization rates.
Methods
We obtained hospital-discharge public-use data files from the health departments of three U.S. border states and looked for cases of diabetes. Only when diabetes was listed as the first diagnosis on the discharge record was it considered a case of diabetes for our study. Patients with cases of diabetes were classified as border county (BC) or nonborder county (NBC) residents.
Comparisons between age-adjusted diabetes discharge rates were made using the z test.
Results
Overall, 1.2% (86,198) of the discharge records had diabetes listed as the primary diagnosis. BC residents had a significantly higher
age-adjusted diabetes discharge rate than NBC residents. BC males had higher diabetes discharge rates than BC females or NBC males. In both the BCs and the NBCs,
Hispanics had higher age-adjusted diabetes discharge rates than non-Hispanics.
Conclusion
The results of this study provide a benchmark against which the effectiveness of
the Healthy Border 2010 program can be measured.
In 2000, a report from CDC’s National Center for Health Statistics showed that diabetes was the sixth leading cause of death in the United States: 25.2 deaths per 100,000 standard population (1). In addition, in 2004, CDC’s National Center for Chronic Disease Prevention and Health Promotion stated that more than 17 million Americans have diabetes and that 200,000 people die each year of complications associated with this condition (2).
Growing evidence strongly suggests that Hispanics or Latinos, African Americans, and Native Americans have a greater predisposition to diabetes than the rest of the U.S. population (3,4). Diabetes prevalence among Hispanics is approximately twice that among non-Hispanic whites (5-8). Consistent findings also relate type 2 diabetes in the Hispanic community with obesity (5-7,9), low income level (7-9), low educational level (7-9), and low level of health insurance (10), all of which are highly prevalent in the U.S.–Mexico border region. In fact, a growing body of research suggests that diabetes is a far too common and rapidly growing problem among Mexican Americans living on the U.S. side of the U.S.–Mexico border (11). Recent health studies found that diabetes prevalence among Hispanics living near the border is more than twice the prevalence among non-Hispanics who live in the same region (12,13). These findings suggest to the public health community that diabetes is reaching epidemic proportions in the U.S.–Mexico border region (14).
In 2000, to address the priority health problems of the population along the U.S.–Mexico border, the U.S.–Mexico Border Health Commission (USMBHC) initiated a disease prevention and health promotion program called Healthy Border 2010 (15). This program is similar to the U.S. program Healthy People 2010 (16), the main goals of which are to improve the quality of health and increase the years of healthy life for all people and to eliminate health disparities among population subgroups. To address health issues at the border, a panel of health experts sponsored by the USMBHC identified a set of health goals and established a 10-year program to eliminate or minimize the effects of selected diseases and conditions in the border region. Two of the selected health goals are to reduce the hospitalization rate for complications of diabetes and to reduce diabetes mortality. However, until now, data on diabetes-related hospitalizations in the border area have never been systematically analyzed. This lack of information about diabetes hospitalizations along the border is a substantial constraint on 1) the development of the Healthy Border 2010 program and efforts to measure its success and 2) the future study of diabetes hospitalization along the border.
The aim of this study is to address the lack of reported data on people hospitalized with diabetes in areas along the U.S. side of the U.S.–Mexico border. Toward this end, we examined the 2000 hospital discharge data for Arizona, California, and Texas and compared those data in a variety of ways.
Hospital-discharge public-use data files were obtained from the health departments of each of the three study states. Although New Mexico is also a border state, it does not have a hospital-discharge public-use data system, and therefore we did not use New Mexico data in our analyses. We received access to the data files and related documents through the intervention of the USMBHC and the border health offices in each study state.
Hospital-discharge data systems gather information on all inpatient hospitalizations, and that information is further processed and recoded for administrative and research purposes. The public version of these data systems can be divided into three main categories. The first includes demographic characteristics of the patients such as age, sex, race, ethnicity, and zip code of residence. The second includes administrative information such as admission date, billing and payment information, discharge date, and discharge status. The third consists of medical information, which includes data on diagnoses and procedures (invasive and noninvasive) performed on the patient. For the purpose of this study, we defined hospital-discharge data as the public record of a person’s stay in a licensed hospital.
Table 1 compares the characteristics of the three hospital-discharge data systems used for this study. All use the International Classification of Diseases, Ninth Revision, Clinical Modification (ICD-9-CM) (17) as the main coding system for data on diagnoses and procedures. In addition, all include demographic information, and all provide data by hospital at the county level. However, they collect varying amounts of data. For example, California collects almost twice as much data on diagnoses and procedures as Arizona and Texas collect, and California and Texas provide more administrative information than Arizona provides.
For the purpose of this study and to be consistent with the methods established by Healthy People 2010 (16), we extracted two types of information from the data files: the first diagnosis listed and the demographic variables. We defined the condition responsible for causing a person to be hospitalized as the first diagnosis listed on that person's discharge record (18). Therefore, we considered diabetes to be responsible for a person’s hospitalization only if the ICD-9-CM code for diabetes was the first diagnosis listed. Because Healthy People 2010 (16) and the Healthy Border 2010 program (15) focus on the entire effect of diabetes, in this study we did not distinguish between type 1 and type 2 diabetes. Information on patients’ sex, ethnicity, age, and county of residence was also extracted from the hospital-discharge public-use data.
A total of 6,994,569 discharge records was completed in the 2000 cycle of the official public-use data files: 8.6% from Arizona, 54.6% from California, and 36.8% from Texas. For the three states combined, we determined that 1.2% (86,198) of the records were for patients with diabetes. Of these patients, 1.5% did not have their sex specified, 0.8% had no ethnicity information, and 0.01% had no data on age. Because of these missing values, data on 2.3% of those determined to have diabetes were excluded from our analyses.
Cases of diabetes were grouped on the basis of the patients’ county of residence reported on the hospital discharge abstract, and the counties were divided into border counties (BCs) and nonborder counties (NBCs). BCs are the 44 counties in four U.S. states (Arizona, California, New Mexico, and Texas) defined as the U.S. section of the U.S.–Mexico border in the La Paz Agreement (1987). NBCs are all the other counties in those states. Since New Mexico data were not available for this study, only 38 of the 44 border counties were included as BCs in this study (Table 2).
For this study, ethnicity was defined as Hispanic (of any race) or non-Hispanic.
We age-adjusted the discharge rates by the direct age-adjustment technique using the U.S. 2000 standard population. This technique allowed us to calculate point estimates for various populations with different age structures (19,20). We also calculated 95% confidence intervals (CIs) around the point estimates.
To show the actual burden of diabetes among different age groups, we calculated age-specific diabetes discharge rates (per 10,000 civilian population) by using as the denominator the postcensal estimates of the U.S. population as of July 2000 (21).
To compare age-adjusted diabetes discharge rates, we used the method proposed by Keppel et al (22) to identify statistical differences between rates or percentages for Healthy People 2010 (16). Keppel et al proposed that if groups are independent and data variability is known, a z test can be used to determine whether differences between groups are statistically significant. For inferential purposes, we considered a likelihood value below .05 as statistically significant. We used SPSS 11.0 statistical software (SPSS Inc. Chicago, Ill) to do these analyses (23).
For the three study states combined, we estimated that the age-adjusted diabetes discharge rate was 15.4 discharges per 10,000 population (95% CI, 15.3–15.5). For males, the rate was 16.5 per 10,000 discharges (95% CI, 16.3–16.6), significantly higher (P < .001) than the age-adjusted diabetes discharge rate for females (14.4 per 10,000; 95% CI, 14.2–14.5) (Table 3).
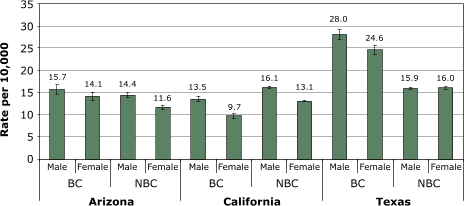
Table 3 also shows the age-adjusted and age-specific discharge rates by state and by region (BC or NBC) stratified by region and sex. Of the three study states, Texas had the highest age-adjusted rate (17.0 per 10,000; 95% CI, 16.8–17.2); California ranked second (14.2 per 10,000; 95% CI, 14.1–14.4) and Arizona third (13.4 per 10,000; 95% CI, 13.1–13.7). Texas also has the highest age-adjusted rates for both males (17.1 per 10,000; 95% CI, 16.8–17.4) and females (16.9 per 10,000; 95% CI, 16.6–17.1). The difference in age-adjusted diabetes discharge rates among border states was statistically significant (P < .001).
Diabetes rates for the border states increased dramatically with age (Table 3). In each state, the diabetes discharge rate was more than three times higher among those aged 15 to 44 years than among those aged 0 to 14, more than double again among those aged 45 to 64, and double again among those aged 65 or older in California and Texas.
Table 3 shows a breakdown of the diabetes discharge rates in the BCs and NBCs. The BCs had a higher age-adjusted diabetes discharge rate (16.6 per 10,000; 95% CI, 16.3–17.0) than the NBCs (14.9 per 10,000; 95% CI, 14.8–15.0). The BC rate was 11.4% higher than the NBC rate (P < .001).
Of the BCs in all three states, Texas BCs had the highest age-adjusted rate (26.1 per 10,000; 95% CI, 25.4–26.9). The age-adjusted rate difference between Texas BCs and the BCs of the other states was statistically significant (P < .001). Furthermore, the rate for Texas BCs was 57% higher than the rate for all BCs combined.
As at the state level, males had higher age-adjusted diabetes discharge rates than females in both BCs and NBCs (Table 3). Texas BCs had the highest diabetes age-adjusted discharge rate both for males (28.0 per 10,000; 95% CI, 26.9–29.2) and females (24.6 per 10,000; 95% CI, 23.6-25.6) (Figure 1). In fact, the diabetes discharge rate for males in Texas BCs was significantly higher that the rate for males in the BCs combined (18.3 per 10,000; 95% CI, 17.8–18.8) (P < .001). Texas BC females also had a higher diabetes discharge rate (24.6 per 10,000; 95% CI, 23.6–25.6) than females in all BCs combined (15.2 per 10,000; 95% CI, 14.8–15.6) (P < .001).
Figure. Age-adjusted diabetes discharge rates by state and by sex, 2000. BC indicates border counties; NBC, nonborder counties.[A tabular version of this graph is also available.]
In each state, Hispanics had significantly higher (P < .001) diabetes discharge rates than non-Hispanics (Table 4).
Hispanics who lived in BCs also had significantly higher age-adjusted diabetes discharge rates (28.4 per 10,000; 95% CI, 27.6–29.1) than non-Hispanics (12.4 per 10,000; 95% CI, 12.0–12.8) (P < .0001). In the BCs, the diabetes discharge rate for Hispanics is about 130% higher than the rate for non-Hispanics. In addition, the diabetes discharge rate for BC Hispanics was significantly higher than the rate for NBC Hispanics (23.5 per 10,000; 95% CI, 23.1–23.8) (P < .001). In both BCs and NBCs, Hispanics had higher diabetes discharge rates than non-Hispanics.
A closer examination of the age-specific diabetes discharge rates in Table 4 shows two important findings. First, unlike all other rates discussed in this article, the rates for young people (aged 0–14 or 15–44 years) were higher for non-Hispanics than for Hispanics, although the rates were relatively low for both ethnicities in these age groups. However, for people aged 65 or older, the diabetes discharge rate was up to four times higher for Hispanics than for non-Hispanics.
Second, Table 4 shows a sharp increase in discharge rates by age for both Hispanics and non-Hispanics. This trend was true in both BCs and NBCs, but it was especially discernible for Hispanics in the BCs combined, where the rate rose from 1.8 per 10,000 for those younger than 15 years to 120.7 per 10,000 for those aged 65 years or older. Diabetes discharge rates were extremely high for elderly Hispanics in the BCs of all three states, ranging from 84 (Arizona) to 137 (Texas) discharges per 10,000 population. For non-Hispanics in the BCs, the diabetes discharge rate for those aged 65 years or older varied only from 29 (Arizona) to 35 (Texas) per 10,000.
Ethnic differences by sex show an undeniable picture of diabetes disparity along the border. Hispanic males in BCs had more than double the diabetes discharge rate of non-Hispanic males (31.5 per 10,000; 95% CI, 30.3–32.7 vs 13.6 per 10,000, 95% CI, 13.0–14.2). Among females in BCs, the ethnic difference was also more than double (25.9 per 10,000; 95% CI, 24.9–26.8 vs 11.3 per 10,000; 95% CI, 10.8–11.8). In both cases, the discrepancy between sex and ethnicity was statistically significant (P < .001). In the NBCs Hispanics of both sexes also had higher diabetes discharge rates than non-Hispanics (Table 4).
Pooled data from the three states also showed that Hispanics had higher age-adjusted diabetes discharge rates than non-Hispanics: Hispanic males had a higher discharge rate (26.8 per 10,000; 95% CI, 26.3–27.3) than non-Hispanic males (16.4 per 10,000; 95% CI, 16.2–16.6), and Hispanic females had a higher discharge rate (23.1 per 10,000; 95% CI, 22.6–23.5) than non-Hispanic females (14.5 per 10,000; 95% CI, 14.4–14.7). For both ethnic groups and in both BCs and NBCs, males had higher diabetes discharge rates than females (Table 4)
This study provides compelling evidence to support claims of ethnic disparities in diabetes discharge rates along the U.S.–Mexico border. Specifically, our study shows that Hispanics who live in BCs have higher rates than non-Hispanics who live in BCs, and even higher rates than Hispanics who live in NBCs.
The unadjusted diabetes discharge rate that we found for the BCs was 31% lower than the rate reported for 2000 by Hall and Owings (24) for the whole United States (20.0 per 10,000). However, the BC rate was 17% higher than the rate they reported for the western region of the United States (12.7 per 10,000).
We also found evidence suggesting that males are more likely than females to have diabetes listed as a first diagnosis on discharge documents. This discrepancy was especially noticeable for Hispanics who live in border counties.
We found that Hispanics aged 45 years or older are more likely than non-Hispanics of the same age to have high diabetes discharge rates. The largest absolute difference occurs for Hispanic males and females older than 65 years. We believe that the high rates for the elderly are due at least in part to lack of access to health care when these people were younger. People with health insurance or other means to pay for health care are more likely than those without means to get treatment for diabetes early in the course of the disease and, consequently, to avoid hospitalization even as they age. As people without means or insurance become older, their disease worsens through lack of preventive care until eventually they are forced to go to the hospital. In the BCs, a large segment of the elderly Hispanic population has always been poor and always lacked access to health care. We consider that these elderly people are now experiencing higher diabetes discharge rates than they would if their disease had been treated early.
Another important finding is that, of the three study states, Texas BCs had the highest diabetes age-adjusted discharge rate for Hispanic males and females. This finding is consistent with the Notzon finding (FC Notzon, personal communication, April 2006). Notzon found unusually high diabetes death rates among Hispanics in the border area of Texas and New Mexico. Further work is needed to explore why diabetes discharge rates for Hispanics who live in the border counties of Texas are so much higher than those for Hispanics who live in the the border counties of Arizona and California.
This study has several limitations. First, results are based only on people with access to hospital inpatient care and exclude people with diabetes who cannot afford a hospital stay, people who use ambulatory care services or emergency department services, and the growing number of people with undiagnosed diabetes.
Second, because the hospital-discharge data used in our study were collected largely for administrative rather than clinical purposes (25), they include limited information on the health of patients.
Third, the three states in our study have different criteria for determining which hospitals are covered by the hospital discharge system. In Texas, for example, the system excludes hospitals in counties with fewer than 35,000 inhabitants, hospitals that are not in urban areas as delineated by the U.S. Census Bureau, hospitals with fewer than 100 beds, and hospitals that do not accept insurance payment or government reimbursement. California includes all licensed acute care hospitals but excludes some state hospitals (26). Arizona collects data on for-profit and nonprofit acute care hospitals (27). One aspect that is common to the three systems is that information from all federal, military, or American Indian reservation hospitals is excluded. The effect of these limitations on the collection of diabetes discharge data in the border region is unknown.
Fourth, we combined data on short- and long-term hospital stays into a single data set, meaning that results of this study are not directly comparable with those of similar studies that used only short-stay hospital discharge data (e.g., the National Hospital Discharge Survey).
Fifth, our results do not reflect the extent to which people crossed the border (in either direction) to receive medical care in hospitals. It is well known that people from the U.S. side of the border travel to Mexico to buy prescriptions or receive medical treatment that costs less there than in United States (28,29). Unfortunately, there is not enough empirical research to show how this phenomenon affects the diabetes hospitalization-discharge rates in the border region.
Finally, because a person can be hospitalized more than once during a year, the estimates provided in this study are based on discharges and not on individuals. However, this practice is consistent with the methods that Hall and Owings (24) describe as being used for the National Hospital Discharge Survey, which does not require that re-admissions be tracked.
Although more recent public use data were available, we limited our analysis to the year 2000 for two reasons: 1) to provide a solid baseline of diabetes discharge rates along the U.S. side of the U.S.–Mexico border and 2) to provide a benchmark to the USMBHC for measuring progress toward one of the Healthy Border 2010 objectives. Our results show that diabetes is a serious problem along the U.S.–Mexico border and suggest the need for further study including, for example, comparing the length of diabetes-related hospital stays among various racial or ethnic groups and evaluating the effectiveness of efforts to address diabetes in the border region.
We hope that this preliminary work will encourage the public health research community to address the aforementioned research needs and will help to reduce the diabetes burden that affects the quality of life of the people who live along the U.S.–Mexico border.
We acknowledge the helpful and wise editorial comments provided by Jill Marsteller, Jennifer Madams, and Graciela Silva. We especially acknowledge the enormous assistance and helpful expert advice from Maria Owings. This work was supported by National Center for Health Statistics, CDC, and by the United States–Mexico Border Health Commission.
Corresponding Author: Juan R. Albertorio-Diaz, International Statistics Program, National Center for Health Statistics, Centers for Disease Control and Prevention, 3311 Toledo Road, Suite 2427, Hyattsville, MD 20782. Telephone: 301-458-4634. E-mail: [email protected].
Author Affiliations: Francis C. Notzon, International Statistics Program, National Center for Health Statistics, CDC; Alfonso Rodriguez-Lainz, Binational Border Health Office of California.
|
|
|
|
|
|
The opinions expressed by authors contributing to this journal do not necessarily reflect the opinions of the U.S. Department of Health and Human Services, the Public Health Service, the Centers for Disease Control and Prevention, or the authors’ affiliated institutions. Use of trade names is for identification only and does not imply endorsement by any of the groups named above.
Privacy Policy | Accessibility This page last reviewed March 30, 2012
|
|