Original site:www.cdc.gov/pcd/issues/2005/jul/05_0021.htm | RestoredCDC.org is an independent project, not affiliated with CDC or any federal entity. Visit CDC.gov for free official information. Due to archival on January 6, 2025, recent outbreak data is unavailable. Videos are not restored. Access data.restoredcdc.org for restored data. Use of this site implies acceptance of this disclaimer.
ORIGINAL RESEARCH
Are Older Adults Up-to-Date With Cancer Screening and Vaccinations?
Douglas Shenson, MD, MPH, MS, Julie Bolen, PhD, MPH, Mary Adams, MPH, Laura Seeff,
MD, Donald Blackman, PhD
Suggested citation for this article: Shenson D, Bolen J, Adams M, Seeff
L, Blackman D. Are older adults up-to-date with cancer screening and vaccinations? Prev Chronic Dis [serial online] 2005 Jul [date cited]. Available from: URL:
http://www.cdc.gov/pcd/issues/2005/
jul/05_0021.htm.
PEER REVIEWED
Abstract
Introduction
Public health organizations in the United States emphasize the importance of
providing routine screening for breast cancer, cervical cancer, and colorectal
cancer, as well as vaccinations against influenza and pneumococcal disease among
older adults. We report a composite measure of adults aged 50 years and older
who receive recommended cancer screening services and vaccinations.
Methods We analyzed state data from the 2002 Behavioral Risk Factor Surveillance System, which included 105,860 respondents aged 50 and older. We created a composite measure that included colonoscopy or sigmoidoscopy
within 10 years or a fecal occult blood test in the past year, an influenza
vaccination in the past year, a Papanicolaou test within 3 years for women with an intact cervix,
a mammogram, and for adults aged 65 and older, a pneumonia vaccination during their lifetime. We performed separate analyses for four age and sex groups: men aged 50 to 64, women aged 50 to 64, men aged 65 and older, and women aged 65 and older.
Results
The percentage of each age and sex group that was up-to-date according to our composite measure ranged from 21.1% of women aged 50 to 64 (four tests) to 39.6% of men aged 65 and older (three tests). For each group, results varied by income, education, race/ethnicity, insurance status, and whether the respondent had a personal physician.
Conclusion These results suggest the need to improve the delivery of cancer screenings and vaccinations among adults aged 50 and older. We propose continued efforts to measure use of clinical preventive services.
Healthy People 2010 is a national initiative that has set specific health and health care objectives (1). These performance targets include the delivery of adult clinical preventive services such as cancer screening and vaccinations. Studies of the effectiveness of these services have been reviewed by the U.S. Preventive Services Task Force (USPSTF) (2), and recommendations for
providing the services have been developed by the Guide to Community Preventive Services (3). Both efforts emphasize the importance of providing routine screening for breast cancer, cervical cancer, and colorectal cancer as well as vaccinations against influenza and pneumococcal disease.
The delivery rates of cancer screenings and adult vaccinations have typically been measured separately through population-based surveys, including the Behavioral Risk Factor Surveillance
System (BRFSS) and the National Health Interview Survey (NHIS). Although this approach is well suited for assessing progress toward Healthy People 2010 objectives, it does not measure the extent to
which individuals receive the full complement of recommended clinical preventive services.
There is currently no index that combines data on the use of all recommended
clinical preventive services among adults. In this article, we present a
composite measure of cancer screening services and vaccinations obtained by
adults aged 50 years and older as a first step toward assessing overall clinical preventive service delivery. We chose to begin our assessment by combining these two sets
of interventions because they are universally recommended and data on their use in all 50 states and the District of Columbia are available through the 2002 BRFSS. Composite indices have long been used for the surveillance of childhood vaccinations (4).
Our approach aims to provide a more meaningful and practical measure of the state of clinical preventive service delivery. Such a comprehensive measure could also enhance the ability of health departments and community groups to assess disparities in delivering preventive services, to better gauge progress toward measurable objectives, and to identify best practices for achieving prevention
goals.
We used data from the 2002 BRFSS; the BRFSS is an ongoing state-based telephone survey of randomly selected adults and is coordinated by the Centers for Disease Control and Prevention (CDC). The survey collects data from noninstitutionalized adults
aged 18 and older on health practices that are related to the leading causes of death and disability (5). We limited our analysis to data from
adults aged 50 and older, including 105,860 respondents in 49 states and the District of Columbia. Illinois data are not reported because approximately half of the female respondents in that state were not asked questions about breast and cervical cancer screening. All results are based on weighted data that account for different probabilities of selection and are adjusted to the total adult
population in each state by age and sex or age, race, and sex.
Measures
We analyzed responses to the BRFSS core questions on the use of clinical preventive services recommended by the USPSTF for adults aged 50 and older: colorectal cancer screening, mammography, Papanicolaou (Pap) test, and influenza and pneumococcal vaccinations
(Table 1). These questions were asked in all states and territories that participated in the 2002 BRFSS survey. All measures of
preventive health services were dichotomized as yes or no based on receipt of the service according to schedules recommended by the USPSTF.
The USPSTF recommends influenza vaccination for adults aged 50 and older (6); other agencies support this recommendation (7). We used a 10-year interval for endoscopy (colonoscopy or sigmoidoscopy) because the BRFSS question did not distinguish
between the two interventions. The USPSTF does not recommend intervals for the use of sigmoidoscopy or colonoscopy; other national guidelines recommend a 5-year interval for sigmoidoscopy and a 10-year interval for colonoscopy (8-10). For all services, people who had never had the test or had the tests outside the designated schedule were included in the group who answered no. Our analysis
excluded respondents with missing values except for respondents missing one colorectal cancer screening value. Because colorectal cancer screening recommendations involve receiving either endoscopy or fecal occult blood testing (FOBT), we did not exclude respondents with missing values for one test if they had the other test within the recommended interval.
From the separate measures for cancer screenings and vaccinations, we created a variable to measure whether a person had received
all of these clinical preventive services as recommended by the USPSTF. Because the recommendations vary by age and sex, this measure, which we call being up-to-date, was determined separately for four age and sex groups. For men
aged 50 to 64, the up-to-date measure included men who met the recommendation for colon cancer screening and influenza vaccination (two services). For women aged 50 to 64, the up-to-date measure included women who met the recommendations for colon cancer screening, breast cancer screening, cervical cancer screening, and influenza vaccination (four services). The up-to-date measure includes women
with a hysterectomy among those who met recommendations for cervical cancer screening. Because a Pap test is not normally recommended for these women, it would be incorrect to classify them as not being up-to-date on cervical cancer screening. For adults aged 65 and older, the up-to-date measure included the cancer screening tests for their sex, plus an influenza vaccination and a
pneumococcal vaccination (three services for men and five services for women). The number of tests required for being up-to-date
was two for men aged 50 to 64, three for men aged 65 and older, four for women aged 50 to 64,
and five for women aged 65 and older (colorectal, breast, and cervical cancer screening
in addition to influenza and pneumonia vaccinations).
From responses to several questions on race and ethnicity that permitted respondents to indicate more than one race, we created five groups: white (limited to non-Hispanic whites), black (limited to non-Hispanic blacks), Hispanic of any race, Asian or Pacific Islander, and American Indian or Alaska Native. Level of education was recoded from multiple responses into four
categories: less than high school, high school graduate or general equivalency
diploma (GED), some college, and college graduate. Health insurance status was
determined by the response to a single question and coded yes or no. Data on household income were coded into four groups: less than $25,000, $25,000 to $49,999, $50,000 to $74,999, and $75,000 and above. Respondents were asked if they had a personal physician; those with
one or more were coded as yes. Health status was dichotomized into 1) fair or poor
or 2) good, very good, or excellent.
Statistical analysis
Stata, Version 8.0 (StataCorp, College Station, Tex), was used in all statistical analyses to account for the complex sample design of the BRFSS. Most analyses were performed on subpopulations representing four age and sex groups: men aged 50 to 64, women aged 50 to 64, men aged 65 and older, and women aged 65 and older. Pearson's chi-square tests were used to compare the percentage of adults who
were up-to-date on the recommended services for their age and sex group by demographic characteristics. For mapping purposes, we divided state results into quartiles and then combined the middle two quartiles.
The median state response rate for the 2002 BRFSS was 58.3% (range 42.2%–82.6%) (11). Results for the individual preventive health services for each of the age and sex groups are presented in Appendix Tables A–D. All other results are for being up-to-date on cancer screening and vaccinations as defined above.
We combined data for 49 states and the District of Columbia to examine the percentage of adults who were up-to-date among demographic and risk-factor subgroups
(Table 2). Black, Hispanic,
and Asian older adults were significantly less likely than whites to be
up-to-date in at least two of the four age and sex groups. On the other hand,
although they did not reach statistical significance, rates for American Indians were
consistently close to rates for whites in three of the four groups.
Among both men and women in all age groups, having more education was strongly related to being up-to-date. Respondents with less than a high school education were much less likely to be up-to-date (range 12.4%–29.5%) than those with a college degree (range 25.4%–43.8%). Similarly, higher income was associated with being up-to-date on cancer screening and vaccinations.
Adults with health insurance were about twice as likely to almost three times as likely to be up-to-date as adults with no insurance. The same was true for adults with a personal physician compared with those without one. Overall, people who reported fair or poor health were more likely to be up-to-date than those
who reported good, very good, or excellent health.
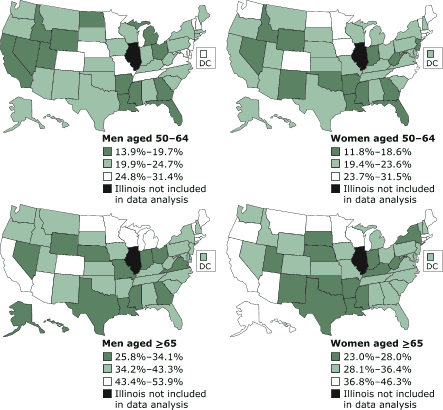
State-specific prevalence estimates for each of the age and sex groups were divided into quartiles and mapped (Figure 1). States in the western and southeastern United States were among
those with the lowest percentage of men aged 50 to 64 who were up-to-date on cancer screening and vaccinations (California, Idaho, Nevada, Utah, and Wyoming in the West; Arkansas, Florida, Georgia, Louisiana,
and Mississippi in the Southeast). There was a similar but less pronounced pattern for women aged 50 to 64 (Idaho, Nevada, and Wyoming in the West; Arkansas, Florida, Georgia, Louisiana, and Mississippi in the Southeast). The percentage of men and women aged 65 and older who were up-to-date was low in Indiana, Louisiana, Mississippi, Nebraska, and Texas. Arizona, California, Minnesota,
North Dakota, Connecticut, Rhode Island, Wisconsin, Massachusetts, and Maine had higher percentages of people aged 65 and older who were up-to-date than most of the other states. Minnesota had the highest percentage of
up-to-date adults in each of the four age and sex groups.
Figure 1. Prevalence estimates of adults aged ≥50
years who were up-to-date for cancer screening and vaccinations by age group, sex, and
state, Behavioral Risk Factor Surveillance System (BRFSS), 2002. Data from 49 states and
the District of Columbia. Results were divided into quartiles, and the middle
two quartiles were combined. Illinois data are not included because the state
used a split sample for some preventive service questions. [A
text description of these maps is also available.]
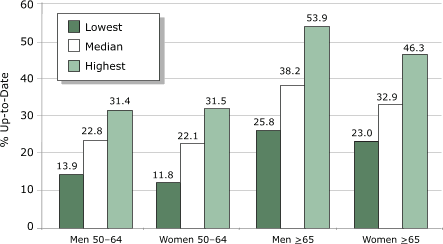
The percentage of each age and sex group that was up-to-date is presented by state in Table 3. The state medians for the percentage of
respondents who were up-to-date were consistently less than 40% (with a range of
22.1% for women aged 50 to 64 to 38.2% for men aged 65 and older) (Figure 2). Median state values were similar to results for all adults reported in Table 2.
Figure 2. Median and range of state-specific results for percentage of adults
aged ≥50 years who were up-to-date
for cancer screening and immunizations, Behavioral Risk Factor Surveillance
System (BRFSS), 2002. Data from 49 states and the District of Columbia. Illinois data
are not included because the state used a split sample for some preventive
service questions. [A
text description of this graph is also available.]
Table 4 shows the
percentage of adults who had zero, one, two, three, four, or five cancer
screenings or vaccinations. Most adults had one or more preventive services, with
the percentage of adults who received none of the services ranging from 3.6% for
women aged 65 and older to 38.3% for men aged 50 to 64. Thus, the results
indicated that at least 61.7% of older men and more than 95% of older women have had
some contact with the health care system within the past few years.
This analysis of state BRFSS data indicates that among the four age and sex groups, the state medians for adults who are up-to-date with recommended cancer screenings and vaccinations range from 22.1% (women aged 50 to 64) to 38.2% (men aged 65 and older). Although the delivery rates of individual clinical preventive services may be relatively high — cervical cancer screening, for
example, is at a national median of 81.0% — overall levels of protection provided by cancer screenings and vaccinations are low.
This study did not include data on cholesterol screening or tetanus–diphtheria vaccination,
or data on clinical preventive services that are also recommended according to a
specific schedule. Other excluded measures included screening for abnormalities of blood pressure, height, weight, obesity, vision, and hearing; chemoprevention for cardiovascular disease (aspirin); and counseling on
calcium intake, folic acid, tobacco cessation, drug and alcohol use, sexually transmitted diseases, human immunodeficiency virus (HIV), nutrition, physical activity, sun exposure, oral health, injury prevention, and polypharmacy.
In addition to low absolute levels, the data indicate important differences among states. For each of the four age and sex groups, Minnesota consistently had the highest up-to-date percentages. Several factors may explain why this state has done so well in preventive service delivery: a high proportion of the population is enrolled in managed care; the state has a low uninsurance rate; and
state-sponsored outreach promotes colorectal cancer screening and adult vaccinations. Additional research is necessary to fully explore the reasons for success in Minnesota. Many of the lowest measurements were found in the southeastern and south-central United States; these states have low rates of health insurance among adults (12).
Each of the four age and sex groups has its own set of recommended clinical preventive services.
Figure 2 illustrates that men and women within each of the two age groups have similar proportions that are up-to-date, despite the fact that more tests are required of women. When compared
with women in the same age group, men are much more likely to have had none of the recommended
services. The reasons for these differences are not clear from the data and require further analysis.
There were significant differences in being up-to-date among racial and
ethnic categories. Based on consistency across age and sex groups, it appears that blacks, Hispanics, and Asians may be less likely than whites to be up-to-date for cancer screenings and adult vaccinations.
There may be higher rates of screening among American Indians because many American Indians receive health care through the Indian Health Service, which emphasizes preventive health practices. Further investigation of these racial and ethnic disparities is warranted.
Not only are reasons for racial and ethnic disparities not clear from the data but these disparities
also are confounded by disparities in being up-to-date according to educational, socioeconomic, and insurance status. Respondents who have a college degree are 1.5 to 2 times more likely to be up-to-date than respondents who do not have a high school degree. Receipt of clinical
preventive services is also consistently associated with higher income level for each of
the four age and sex groups. Large differences exist between people who have medical insurance and people who do not. People with health insurance or personal physicians have approximately two to three times the rate of clinical preventive service delivery as people without
either of them. According to the U.S. Census,
11.1% of whites, 19.6% of blacks, 18.8% of Asians, and 32.7% of Hispanics lacked insurance in 2003 (13). These findings are consistent with those of other studies that have found significant disparities in the delivery of cancer screening (14-16) and adult vaccinations (17,18) when measured by race/ethnic group, education, and income.
More than 95% of adults aged 65 and older have health insurance through
Medicare, which pays for cancer screening and vaccinations (19). Nonetheless,
fewer than 40% of this age group are up-to-date on all of the recommended cancer screening and vaccinations. Having health insurance (and a personal physician) —
although necessary — is not in itself sufficient for achieving high
levels of being up-to-date with cancer screenings and vaccinations.
Our results suggest that most respondents have received at least one cancer screening or vaccination. Therefore, most adults aged 50 and older have
had some contact with the health care system within the past few years, but they do not receive the preventive services recommended for their age and sex group. At the same time, the analysis indicates that up-to-date rates are not low because adults lack only a single
service.
This work builds on the analysis of others (20). The BRFSS has followed state rates for clinical preventive service delivery for more than 20 years, and a recent study has provided a comprehensive overview of trends (21). Combined measurements of mammography, clinical breast exam, and Pap testing have been made using
data from the 1990 NHIS of Health Promotion and Disease Prevention (22). A methodology for building a prevention index has also been developed using electronic medical records. This index can serve as a combined quality assessment measure and be compared with consensus measures or with selected Health Plan Employer Data and Information Set (HEDIS) scores for health management organizations (23).
This study has a number of limitations. First, the BRFSS relies on self-reported data. Depending on the measure, self-reports can result in overestimates or underestimates compared with other data sources, such as health care records. Unfamiliarity with medical terms and telescoping (24) (recalling events more recently than they actually occurred) can affect the validity of self-reported
clinical preventive services and probably result in overestimates (20,25). A review article by Nelson
et al rates the validity of self-reports for mammography, Pap test, colorectal cancer screening, and pneumococcal vaccination as moderate and the validity for influenza vaccination as high (26). Second, households without telephones, which are more likely to have adults with low
socioeconomic status, were excluded from the survey. This omission may have resulted in an overestimation of delivery rates (27). Third, the survey excludes people who rely only on cellular telephones for their telephone service. Finally, the BRFSS questions limited our ability to adequately determine compliance with Pap test recommendations for women aged 65 and older. The USPSTF recommends
against routine screening for cervical cancer for women in this age group if they have had sufficient recent Pap tests with no abnormal results and are not otherwise at increased risk for cervical cancer (28). Without Pap test histories, we could not ascertain which of these older women might not need further Pap testing, and thus we were unable to determine how this anomaly in the recommendations
might have affected our estimates of being up-to-date on the Pap test among women aged 65 and older.
The results of this study suggest several potential next steps. From a surveillance perspective, we recommend that state-based surveys such as the BRFSS consider periodically collecting in the same year information about clinical preventive services with specific schedules (i.e., the services analyzed in this study as well as cholesterol screening and tetanus–diphtheria vaccination). In this way, a more complete measure of delivered adult clinical preventive services recommended by age and sex can be calculated. One of the strengths of a composite measure of clinical preventive services is that it emphasizes the overall protection of individuals by combining measurements across disease categories. We also recommend that surveys such as the BRFSS examine the
feasibility and implications of routinely reporting a composite measure such as the one suggested by this study.
The building blocks of composite measures will change as recommendations for individual interventions evolve. For example, colorectal cancer screening guidelines for Healthy People
2010 objectives have not yet been updated to match USPSTF recommendations. (Healthy
People 2010 objectives for Pap test, mammography, and adult vaccinations are consistent with USPSTF recommendations for women aged 50 and older.)
The results of this study also suggest that the delivery of clinical preventive services in physicians’ offices needs continued attention. Among respondents who indicated having a personal physician, the group with the highest proportion
of up-to-date was men aged 65 and older at only 41.5%; the group with the lowest proportion was women aged 50 to 64 at 22.8%. Despite important initiatives designed
to improve the provision of clinical preventive services in physicians’ offices, such as the Agency for Healthcare Research and Quality’s Put Prevention
Into Practice (PPIP) (29), more work is necessary to enhance chart-flagging systems and improve reminder protocols aimed at patients. Physicians have begun to systematically consider various approaches to addressing multiple behavioral
risk factors in primary care (30), and we hope that this commitment can be extended to providing multiple clinical preventive services.
From a public health standpoint, new kinds of programs are needed to address the shortfall identified by this study. Access to each of the recommended clinical preventive services can be facilitated inside and outside of the clinical setting.
New initiatives must focus on populations, not patient panels. A community-wide strategy has been developed by the Sickness Prevention
Achieved through Regional Collaboration (SPARC) program in Connecticut, Massachusetts, and New York, and has achieved promising results (31,32) by expanding delivery at clinical sites and creating new points of access in nonclinical settings. A similar approach has been taken by New York State’s Healthy Women Partnerships, which facilitates the delivery of multiple cancer screenings for
underserved populations. Community-wide assurance of clinical preventive services has been a priority for the Group Health Cooperative, a nonprofit health care system based in Seattle, Wash, which covers a large proportion of its region’s residents (33).
Additional analytic work is necessary. An examination of data from states that collect information on cholesterol screening and tetanus–diphtheria vaccinations will yield a more complete — and perhaps lower — composite measure of up-to-date use of recommended services. A multivariable regression analysis will provide a fuller understanding of factors that are most strongly and
independently associated with failure to be up-to-date, and a longitudinal analysis of trends in the composite measure will yield useful information for targeting state preventive health efforts.
This study reports low composite rates of adult clinical preventive service delivery based on 2002 BRFSS data for adults aged 50 and older and highlights significant disparities among groups. We
must redouble our efforts to develop more effective approaches to delivering these basic adult clinical preventive services.
Corresponding Author: Douglas Shenson, MD, MPH, MS, 76 Prince St, Newton, MA 02465. The author is affiliated with Sickness Prevention Achieved through Regional Collaboration (SPARC), Lakeville, Conn. Telephone: 617-796-7966. E-mail: [email protected].
Author Affiliations: Julie Bolen, PhD, MPH, Laura Seeff, MD, Donald Blackman,
PhD, Centers for Disease Control and Prevention, Atlanta, Ga; Mary Adams, MPH, On Target Health Data LLC, Hartford, Conn.
U.S. Department of Health and Human Services. Healthy People 2010: understanding and
improving health. 2nd ed. Washington (DC): U.S. Government Printing Office; 2000
Nov.
U.S. Department of Health and Human Services. Guide to clinical preventive
services. U.S. Preventive Services Task Force. 3rd ed. Washington (DC): U.S.
Government Printing Office; 2004
Apr.
Zaza S, Briss PA, Harris KW, editors. The guide to community preventive services:
what works to promote health? Task Force on Community Preventive Services. New
York (NY): Oxford University Press; 2005.
Barker L, Santoli J, McCauley M. National, state, and urban area vaccination coverage among children aged 19-35 months — U.S. 2003. MMWR 2004;53(29):658-61.
Clinical Preventive Services for Normal-Risk Adults Recommended by the
U.S. Preventive Services Task Force. Put Prevention into Practice.
Agency for Healthcare Research and Quality. Rockville (MD);2004 Jan. Available from:
URL: http://www.ahrq.gov/ppip/adulttm.htm.
Centers for Disease Control and Prevention. 2002 Behavioral Risk Factor
Surveillance System summary data quality report. Atlanta (GA): Centers for
Disease Control and Prevention. Available from: URL: http://www.cdc.gov/brfss/technical_infodata/pdf/
2002SummaryDataQualityReport.pdf.
Mills RJ, Bhandari S. Health insurance coverage in the United States, 2002.
Current Population Reports, P60-223. Washington (DC): U.S. Census Bureau; 2003.
p.1-24.
DeNavas-Walt C, Proctor BD, Mills RJ. Income, poverty, and health
insurance coverage in the United States, 2003. Current Population Reports, P60-226.
Washington (DC): U.S. Census Bureau; 2004.
U.S. Department of Health and Human Services. The guide to medicare prevention
services: for physicians, providers, suppliers, and other health care
professionals. Center for Medicare and Medicaid Services. CMS-10110.
Washington (DC): U.S. Government Printing Office: 2004 Aug.
Thornberry OT, Massey JT. Trends in the United States telephone coverage across time and subgroup. In: Groves RM, Biemer PP, Lyberg LR, Massey JT, Nichols WL, editors. Telephone
survey methodology. New York (NY): John Wiley & Sons; 1988. p. 25-49.
Agency for Healthcare Research and Quality. About PPIP: Put Prevention Into Practice, 2000.
Rockville (MD): Agency for Healthcare Research and Quality; 2000. Available from:
URL:
http://www.ahrq.gov/ppip/ppipabou.htm.
Table 1. Clinical Preventive Services Recommended for Adults Aged 50
Years and Older by the United States Preventive Services Task Force (USPSTF), 2004a
Measure
Definition
Age Groups for Which Services Are Recommended
Men 50-64
Women 50-64
Men ≥65
Women ≥65
Influenza vaccination
Received in past 12 months
Men and women ≥50
X
X
X
X
Pneumococcal vaccination
Ever received
Men and women ≥65
X
X
Mammogram
Received in past 2 years
Women ≥40
X
X
Pap test
Received in past 3 years
Women ≥18 with intact cervix
X
X
Colorectal cancer screeningb
Received FOBT in past 12 months or endoscopy in past 10 years
Men and women ≥50
X
X
X
X
Cholesterol screeningc
Every 5 years
Men ≥35; women ≥45
X
X
X
X
Tetanus– diphtheria vaccinationc
Every 10 years
Men and women ≥18 years
X
X
X
X
aEmpty cells indicate that the service does not apply to the demographic category. bIncludes receiving fecal occult blood test (FOBT) or endoscopy (sigmoidoscopy or colonoscopy) within recommended time frames. cThese services are recommended by the USPSTF, but data were not collected by all states in the Behavioral Risk Factor Surveillance System (BRFSS), 2002, and were not analyzed as part of this study.
Table 2. Respondents Aged 50
Years and Older Who Are Up-To-Date for Cancer Screening and Adult Immunization by Age
and Sex Group and Demographic Characteristics, Behavioral Risk Factor Surveillance System (BRFSS), 2002a
Men 50-64b
% (95% CI)
Women 50-64c
% (95% CI)
Men ≥65d
% (95% CI)
Women ≥65e
% (95% CI)
All Adults ≥50
% (95% CI)
Race/ethnicity
White (non-Hispanic)
22.7 (21.8-23.7)
22.2 (21.4-23.0)
41.7 (40.3-43.0)
34.6 (33.6-35.6)
29.2 (28.7-29.7)
Black (non-Hispanic)
18.6 (15.2-22.6)
16.5 (14.1-19.3)
26.2 (20.9-32.3)
21.0 (17.4-25.2)
19.4 (17.7-21.3)
Hispanic (all races)
13.3 (9.8-17.8)
17.9 (14.3-22.1)
30.8 (22.0-41.2)
22.2 (15.2-31.3)
19.1 (16.4-22.2)
Asian or Pacific Islanderf
12.4 (7.8-19.0)
20.1 (12.2-31.3)
25.7 (17.4-36.3)
21.1 (10.6-37.7)
17.6 (13.3-22.9)
American Indian
or Alaska Nativef
25.4 (14.4-40.9)
17.7 (10.3-28.9)
41.0 (25.0-59.1)
28.2 (12.1-52.8)
26.6 (19.8-34.6)
P valueg
<.001
.03
<.001
<.001
<.001
Education
<High school degree
12.4 (10.1-15.0)
15.5 (13.2-18.1)
29.5 (26.6-32.6)
22.7 (20.0-25.5)
20.4 (19.0-21.8)
High school degree or
general equivalency diploma (GED)
18.8 (17.3-20.4)
18.5 (17.4-19.8)
38.5 (36.0-41.0)
30.5 (29.1-31.9)
25.5 (24.7-26.3)
Some college
22.0 (20.2-24.0)
21.9 (20.5-23.4)
43.8 (40.9-46.9)
38.4 (36.3-40.5)
29.4 (28.3-30.4)
College degree
25.4 (23.8-27.0)
25.4 (23.9-27.1)
43.8 (41.5-46.1)
38.9 (36.3-41.5)
30.9 (29.9-31.8)
P valueg
<.001
<.001
<.001
<.001
<.001
Annual income,$h
<25,000
16.9 (15.0-19.1)
16.4 (15.0-17.8)
35.1 (32.7-37.5)
27.2 (25.8-28.7)
24.2 (23.3-25.1)
25,000-49,999
19.4 (17.8-21.1)
21.1 (19.7-22.6)
42.4 (40.0-44.7)
37.2 (35.1-39.4)
28.9 (27.9-29.8)
50,000-74,999
21.7 (19.7-23.8)
22.0 (20.2-23.9)
43.1 (39.2-47.2)
40.5 (35.3-45.9)
26.9 (25.6-28.3)
≥75,000
25.6 (23.8-27.5)
25.3 (23.4-27.4)
42.4 (38.4-46.4)
43.5 (38.1-49.1)
28.6 (27.4-30.0)
P valueg
<.001
<.001
<.001
<.001
<.001
Insured
Yes
23.3 (22.3-24.3)
23.1 (22.3-24.0)
40.1 (38.7-41.4)
32.8 (31.8-33.8)
28.9 (28.4-29.4)
No
7.9 (6.6-9.5)
7.8 (6.4-9.5)
19.1 (13.9-25.6)
16.5 (11.5-23.3)
9.0 (8.0-10.2)
P
value
<.001
<.001
<.001
<.001
<.001
Personal physician
Yes
24.0 (22.9-25.0)
22.8 (21.9-23.6)
41.5 (40.1-42.9)
33.8 (32.8-34.9)
29.3 (28.8-29.8)
No
8.0 (6.7-9.6)
6.6 (5.0-8.5)
20.7 (16.8-25.2)
12.2 (9.7-15.1)
10.1 (9.1-11.3)
P
value
<.001
<.001
<.001
<.001
<.001
Health status
Fair or poor
26.2 (24.0-28.6)
22.0 (20.3-23.8)
41.5 (39.0-44.1)
31.6 (29.6-33.6)
30.0 (28.9-31.1)
Good, very good, or excellent
20.4 (19.4-21.4)
20.9 (20.0-21.8)
38.9 (37.3-40.4)
32.9 (31.7-34.1)
26.5 (25.9-27.0)
P value
<.001
.27
.08
.29
.001
Total
21.4 (20.5-22.3)
21.1 (20.3-21.9)
39.6 (38.2-40.9)
32.4 (31.4-33.4)
27.3 (26.8-27.8)
No. BRFSS respondents aged ≥50 (%)
23,568 (22.3)
33,389 (31.5)
17,187 (16.2)
31,716 (30.0)
105,860
No. BRFSS
respondents aged ≥50 with missing data other than annual income (%)h
609 (2.6)
982 (2.9)
1,327 (7.7)
2,779 (8.8)
5,697 (5.4)
No. BRFSS respondents aged ≥50 with complete data
(except annual income)h
22,959
32,407
15,860
28,937
100,163
aN = 100,163; includes complete sets of data from 49 states and the District of Columbia. Illinois data are not included because the state used a split sample for some preventive services questions. CI indicates confidence interval. bMen aged 50–64 were up-to-date for preventive services if they met screening recommendations for colorectal cancer and had an influenza vaccination in the past year. cWomen aged 50–64 were up-to-date for preventive services if they met screening recommendations for breast cancer, cervical cancer, colorectal cancer, and had an influenza vaccination in the past year. dMen aged ≥65 were up-to-date for preventive services if they met screening recommendations for colorectal cancer, had an influenza vaccination in the past year, and had ever had a pneumococcal vaccination. eWomen aged ≥65 were up-to-date on preventive services if they met
screening recommendations for breast cancer, cervical cancer, and
colorectal cancer, had an influenza vaccination in the past year, and had
ever had a pneumococcal vaccination. fThese estimates are based on small numbers of respondents, resulting in wide confidence intervals and potentially unstable point estimates, and should be interpreted with caution. gP values <.05 indicate that being up-to-date is
associated with a demographic characteristic within an age and sex group
based on Pearson's chi-square test but do not specify which groups are
significantly different from each other. hN = 82,769 for annual income; 17.4% (17,394/100,163) of otherwise complete questionnaires were missing data on annual income.
Table 3. Percentage of Respondents Who Are Up-To-Date for Cancer Screening and Vaccinations, by State, Behavioral Risk Factor Surveillance System (BRFSS), 2002
Men 50-64a
Women 50-64b
Men
≥65c
Women ≥65d
N
% (95% CI)e
N
% (95% CI)
N
% (95% CI)
N
% (95% CI)
Alabama
265
20.1 (15.3-25.9)
486
22.0 (18.4-26.2)
206
34.7 (27.9-42.2)
482
29.8 (25.4-34.7)
Alaska
299
22.7 (16.3-30.6)
323
22.2 (15.7-30.3)
127
25.8 (16.3-38.4)
166
36.8 (25.6-49.7)
Arizona
326
24.4 (17.9-32.2)
512
22.9 (18.3-28.3)
331
48.8 (41.3-56.3)
527
38.0 (32.0-44.4)
Arkansas
380
19.3 (15.4-24.0)
598
16.4 (13.5-19.8)
321
38.2 (32.5-44.2)
600
27.2 (23.3-31.4)
California
385
18.0 (14.2-22.5)
531
21.0 (17.3-25.3)
277
45.7 (38.6-53.0)
472
38.1 (32.3-44.2)
Colorado
371
26.7 (21.2-33.1)
602
27.9 (24.1-32.0)
234
48.3 (41.2-55.4)
432
34.0 (28.7-39.7)
Connecticut
592
24.7 (20.6-29.3)
712
28.6 (24.6-32.9)
392
44.3 (38.5-50.3)
708
39.0 (34.7-43.5)
Delaware
373
30.4 (24.2-37.4)
552
27.7 (23.2-32.7)
348
38.8 (32.3-45.7)
575
37.4 (32.3-42.9)
District of Columbia
210
27.8 (21.1-35.6)
282
21.4 (16.4-27.4)
146
34.5 (25.8-44.4)
259
31.0 (24.6-38.3)
Florida
574
15.6 (12.7-19.0)
869
15.9 (13.3-18.8)
600
36.6 (32.4-41.1)
957
32.4 (29.0-36.0)
Georgia
430
15.5 (11.9-19.9)
714
18.3 (15.1-22.0)
290
33.0 (27.1-39.5)
598
28.1 (23.8-32.8)
Hawaii
661
20.7 (16.6-25.6)
798
21.2 (17.6-25.3)
485
33.8 (28.5-39.6)
764
34.1 (29.6-38.8)
Idaho
505
19.7 (15.8-24.3)
646
17.6 (14.4-21.2)
388
34.2 (28.9-39.8)
688
29.5 (25.4-34.0)
Illinoisf
---
---
---
---
---
---
---
---
Indiana
508
23.7 (19.8-28.1)
830
17.3 (14.7-20.3)
388
33.3 (28.3-38.8)
710
23.2 (19.8-27.0)
Iowa
337
24.2 (19.4-29.8)
517
24.9 (20.8-29.4)
291
42.0 (35.7-48.6)
630
34.3 (29.8-39.1)
Kansas
455
20.6 (16.8-25.0)
612
23.4 (19.9-27.4)
307
43.2 (37.0-49.5)
586
28.5 (24.3-33.0)
Kentucky
605
22.3 (17.7-27.8)
1097
20.0 (16.6-23.8)
506
36.3 (30.6-42.4)
1315
26.8 (23.2-30.8)
Louisiana
419
13.9 (10.3-18.3)
744
14.7 (12.2-17.6)
334
31.0 (25.7-36.9)
692
23.0 (19.7-26.7)
Maine
251
23.9 (18.6-30.1)
362
29.7 (24.7-35.1)
161
50.1 (41.5-58.6)
318
37.8 (31.9-44.0)
Maryland
424
26.1 (21.6-31.1)
635
23.7 (19.9-27.8)
289
46.4 (38.8-54.2)
478
33.6 (28.2-39.4)
Massachusetts
662
23.2 (19.6-27.3)
883
24.9 (21.6-28.4)
499
43.8 (38.5-49.2)
908
37.4 (33.3-41.6)
Michigan
607
19.0 (15.6-22.9)
855
22.4 (19.2-25.9)
435
43.4 (37.8-49.1)
740
33.2 (29.0-37.6)
Minnesota
479
31.4 (27.0-36.0)
590
31.5 (27.5-35.9)
305
53.9 (47.7-60.0)
640
46.3 (41.9-50.8)
Mississippi
373
19.7 (15.5-24.8)
607
15.8 (13.0-19.0)
248
28.9 (23.1-35.5)
647
27.4 (23.5-31.7)
Missouri
445
25.3 (20.0-31.6)
685
21.3 (17.3-25.8)
381
31.1 (25.4-37.5)
761
29.4 (24.9-34.3)
Montana
486
21.1 (15.9-27.4)
556
21.1 (17.0-25.7)
311
35.7 (28.9-43.2)
537
39.7 (34.1-45.6)
Nebraska
356
25.4 (20.8-30.7)
539
23.6 (19.8-27.9)
393
32.4 (27.4-37.7)
754
26.7 (23.0-30.7)
Nevada
400
16.9 (12.1-23.0)
366
11.8 (8.6-16.1)
266
32.9 (25.3-41.5)
337
34.2 (27.5-41.6)
New Hampshire
538
26.2 (22.1-30.6)
692
23.3 (20.0-26.9)
331
39.8 (34.0-45.8)
562
34.2 (29.9-38.9)
New Jersey
612
24.8 (18.1-32.9)
813
15.2 (10.5-21.5)
491
39.9 (31.6-48.9)
813
33.3 (26.8-40.4)
New Mexico
502
20.0 (16.3-24.3)
709
16.8 (13.8-20.2)
410
38.6 (33.2-44.3)
625
26.7 (22.4-31.6)
New York
399
23.2 (18.7-28.3)
575
23.6 (19.8-27.8)
289
43.3 (36.7-50.2)
532
28.0 (23.8-32.5)
North Carolina
618
22.9 (18.3-28.3)
948
25.3 (21.5-29.6)
485
40.4 (33.4-47.7)
944
34.0 (29.5-38.7)
North Dakota
325
18.7 (14.6-23.6)
375
25.9 (21.4-31.0)
206
46.5 (39.1-54.2)
439
37.7 (32.3-43.4)
Ohio
398
17.8 (13.9-22.4)
548
20.2 (16.7-24.3)
262
34.1 (27.6-41.3)
513
29.5 (24.7-34.9)
Oklahoma
709
23.1 (19.5-27.0)
1024
18.6 (16.2-21.3)
605
38.2 (34.0-42.6)
1083
25.7 (22.8-28.8)
Oregon
328
20.2 (15.8-25.3)
467
21.3 (17.6-25.6)
213
34.5 (27.7-41.9)
408
39.1 (33.8-44.7)
Pennsylvania
1351
22.6 (19.9-25.6)
1818
19.5 (17.3-22.0)
999
40.2(36.4-44.2)
1985
32.6 (29.9-35.5)
Rhode Island
330
25.1 (20.3-30.5)
500
25.7 (21.7-30.1)
273
48.4 (41.9-55.0)
477
37.9 (33.1-43.1)
South Carolina
460
19.9 (15.8-24.7)
666
22.6 (18.7-27.0)
319
42.6 (35.8-49.7)
583
36.1 (31.0-41.5)
South Dakota
462
23.7 (19.8-27.9)
634
22.7 (19.2-26.7)
415
35.2 (30.1-40.6)
775
26.5 (23.3-30.1)
Tennessee
302
28.7 (23.4-34.6)
462
23.3 (19.4-27.7)
249
38.1 (31.5-45.2)
423
30.3 (25.5-35.6)
Texas
489
20.6 (16.9-24.8)
772
19.4 (16.5-22.6)
359
31.9 (26.7-37.5)
672
27.1 (23.2-31.4)
Utah
409
17.2 (13.1-22.3)
449
22.8 (18.0-28.5)
285
41.9 (35.1-48.9)
403
27.8 (22.2-34.1)
Vermont
477
25.6 (21.6-30.1)
570
24.6 (21.0-28.6)
312
49.9 (43.8-56.1)
509
35.0 (30.4-39.9)
Virginia
422
25.9 (20.3-32.3)
606
21.4 (17.3-26.1)
292
33.9 (26.8-41.9)
513
32.5 (27.7-37.8)
Washington
478
23.5 (19.2-28.4)
679
24.5 (20.8-28.6)
324
36.5 (30.7-42.7)
597
36.4 (31.6-41.6)
West Virginia
336
21.7 (17.4-26.8)
504
17.1 (13.8-21.0)
276
35.7 (29.7-42.1)
570
24.4 (20.6-28.6)
Wisconsin
427
23.8 (19.5-28.7)
576
23.1 (19.4-27.3)
282
45.4 (38.6-52.4)
565
38.7 (33.9-43.6)
Wyoming
409
19.3 (15.5-23.9)
517
16.3 (13.2-20.0)
251
33.1 (27.0-39.8)
444
30.0 (25.5-34.9)
Lowest
13.9
11.8
25.8
23.0
Highest
31.4
31.5
53.9
46.3
Mediang
22.8
22.1
38.2
32.9
aMen aged 50–64 were up-to-date for preventive services if they met screening recommendations for colorectal cancer and
had an influenza vaccination in the past year. bWomen aged 50–64 were up-to-date for preventive services if they met screening recommendations for breast cancer, cervical cancer, colorectal cancer, and had an influenza vaccination in the past year. cMen aged ≥65 were up-to-date for preventive services if they met screening recommendations for colorectal cancer, had an influenza vaccination in the past year, and had ever had a pneumococcal vaccination. dWomen aged ≥65 were up-to-date for preventive services if they met screening recommendations for breast cancer, cervical cancer, and colorectal cancer, had an influenza vaccination in the past year, and had ever had a pneumococcal vaccination. eCI indicates confidence interval. fIllinois data are not included because the state used a split sample for some preventive services questions. gMedian represents the median value among the 49 states and the District of Columbia.
Table 4. Number of Preventive Services Received by Age and Sex
Group, Behavioral Risk Factor Surveillance System (BRFSS), 2002a
No. Preventive Services Received
0
1
2
3
4
5
Men aged 50-64b
38.3
40.3
21.4
NAc
NA
NA
Men aged ≥65d
12.6
20.5
27.3
39.6
NA
NA
Women aged 50-64e
4.7
9.0
28.2
37.0
21.1
NA
Women aged ≥65f
3.6
5.5
11.9
19.5
27.1
32.4
aAll values represent percentages. Includes data from 49 states and the District of Columbia. Illinois data are not included because the state used a split sample for some preventive services questions. bMen aged 50–64 were up-to-date for preventive services if they received two services (described in Table 1). cNA indicates not applicable. dMen aged ≥65 were up-to-date for preventive services if they received three services (described in Table 1). eWomen aged 50–64 were up-to-date for preventive services if they received four services (described in Table 1). fWomen aged ≥65 were up-to-date for preventive services if they received five services (described in Table 1).
Appendix Table A. Prevalence of Receipt of Preventive Services for Men Aged 50–64 Years, Behavioral Risk Factor Surveillance System (BRFSS), 2002
Colon Cancer Screeninga
Influenza vaccinationb
Up-to-Datec
N
%
(95% CI)d
%
(95% CI)
%
(95% CI)
Alabama
273
46.5
(40.0-53.1)
35.3
(29.4-41.7)
20.1
(15.3-25.9)
Alaska
308
49.9
(41.5-58.3)
37.0
(29.4-45.3)
22.7
(16.3-30.6)
Arizona
330
49.0
(40.0-58.1)
31.8
(24.6-39.9)
24.4
(17.9-32.2)
Arkansas
390
38.1
(33.0-43.5)
37.3
(32.2-42.6)
19.3
(15.4-24.0)
California
393
43.7
(37.9-49.6)
31.1
(26.1-36.6)
18.0
(14.2-22.5)
Colorado
384
48.1
(42.0-54.2)
44.2
(38.3-50.3)
26.7
(21.2-33.1)
Connecticut
617
56.1
(51.0-61.1)
35.6
(31.0-40.4)
24.7
(20.6-29.3)
Delaware
376
58.2
(51.2-64.9)
45.7
(38.8-52.7)
30.4
(24.2-37.4)
District of Columbia
215
59.8
(51.5-67.7)
34.4
(27.3-42.4)
27.8
(21.1-35.6)
Florida
592
47.9
(43.0-52.7)
26.5
(22.6-30.7)
15.6
(12.7-19.0)
Georgia
445
45.1
(39.6-50.7)
30.8
(25.9-36.2)
15.5
(11.9-19.9)
Hawaii
675
41.4
(36.2-46.7)
34.4
(29.3-39.9)
20.7
(16.6-25.6)
Idaho
519
44.7
(39.8-49.8)
33.3
(28.7-38.3)
19.7
(15.8-24.3)
Illinoise
---
---
----
---
---
----
----
Indiana
518
45.2
(40.4-50.0)
40.8
(36.3-45.6)
23.7
(19.8-28.1)
Iowa
340
45.0
(39.1-51.0)
44.8
(39.0-50.7)
24.2
(19.4-29.8)
Kansas
466
48.8
(43.8-53.7)
35.2
(30.6-40.1)
20.6
(16.8-25.0)
Kentucky
642
46.0
(40.4-51.6)
38.5
(33.2-44.1)
22.3
(17.7-27.8)
Louisiana
437
42.6
(37.2-48.2)
26.6
(22.1-31.6)
13.9
(10.3-18.3)
Maine
257
53.1
(46.2-59.8)
36.7
(30.5-43.4)
23.9
(18.6-30.1)
Maryland
437
56.9
(51.0-62.5)
38.4
(33.1-43.9)
26.1
(21.6-31.1)
Massachusetts
693
59.2
(54.7-63.6)
35.8
(31.6-40.2)
23.2
(19.6-27.3)
Michigan
616
52.0
(47.1-56.8)
29.1
(25.1-33.5)
19.0
(15.6-22.9)
Minnesota
482
60.7
(55.9-65.2)
42.7
(38.0-47.5)
31.4
(27.0-36.0)
Mississippi
394
39.7
(34.4-45.3)
36.3
(31.2-41.7)
19.7
(15.5-24.8)
Missouri
451
52.5
(46.1-58.8)
38.8
(32.7-45.3)
25.3
(20.0-31.6)
Montana
502
38.9
(32.9-45.2)
40.7
(34.8-46.9)
21.1
(15.9-27.4)
Nebraska
365
46.7
(41.0-52.4)
40.7
(35.3-46.4)
25.4
(20.8-30.7)
Nevada
410
41.7
(34.6-49.1)
27.1
(21.3-33.8)
16.9
(12.1-23.0)
New Hampshire
553
56.5
(51.8-61.1)
37.5
(33.0-42.1)
26.2
(22.1-30.6)
New Jersey
631
50.4
(42.3-58.6)
38.0
(30.4-46.3)
24.8
(18.1-32.9)
New Mexico
513
42.7
(37.8-47.8)
37.8
(33.1-42.8)
20.0
(16.3-24.3)
New York
417
54.0
(48.0-59.9)
35.7
(30.3-41.5)
23.2
(18.7-28.3)
North Carolina
631
49.6
(43.9-55.3)
37.7
(32.3-43.3)
22.9
(18.3-28.3)
North Dakota
333
35.4
(30.2-41.1)
32.8
(27.7-38.3)
18.7
(14.6-23.6)
Ohio
414
47.6
(41.8-53.5)
29.3
(24.5-34.7)
17.8
(13.9-22.4)
Oklahoma
718
36.2
(32.3-40.4)
46.5
(42.3-50.7)
23.1
(19.5-27.0)
Oregon
336
47.3
(41.3-53.3)
35.4
(29.9-41.3)
20.2
(15.8-25.3)
Pennsylvania
1388
47.1
(43.7-50.5)
37.3
(34.1-40.6)
22.6
(19.9-25.6)
Rhode Island
335
53.8
(47.7-59.8)
39.4
(33.7-45.3)
25.1
(20.3-30.5)
South Carolina
471
45.2
(39.4-51.2)
34.5
(29.2-40.2)
19.9
(15.8-24.7)
South Dakota
469
36.6
(32.0-41.5)
48.1
(43.0-53.2)
23.7
(19.8-27.9)
Tennessee
306
50.5
(44.0-57.0)
42.0
(35.9-48.4)
28.7
(23.4-34.6)
Texas
494
41.5
(36.7-46.5)
33.2
(28.4-38.5)
20.6
(16.9-24.8)
Utah
413
40.0
(34.0-46.4)
32.8
(27.3-38.9)
17.2
(13.1-22.3)
Vermont
488
58.0
(53.1-62.7)
35.2
(30.7-39.9)
25.6
(21.6-30.1)
Virginia
441
52.6
(45.8-59.4)
41.4
(34.7-48.4)
25.9
(20.3-32.3)
Washington
494
51.4
(45.7-57.1)
37.5
(32.4-43.0)
23.5
(19.2-28.4)
West Virginia
340
42.0
(36.4-47.7)
37.4
(32.0-43.1)
21.7
(17.4-26.8)
Wisconsin
441
55.1
(49.6-60.4)
36.0
(31.0-41.2)
23.8
(19.5-28.7)
Wyoming
415
34.5
(29.5-40.0)
41.1
(35.2-47.3)
19.3
(15.5-23.9)
Lowest
34.5
26.5
13.9
Highest
60.7
48.1
31.4
Medianf
47.4
36.9
22.8
aMet colorectal cancer screening recommendation (had either fecal occult blood testing [FOBT] in the past year or endoscopy [colonoscopy or sigmoidoscopy] within the past 10 years). bMet immunization recommendation for influenza vaccination (influenza vaccination in
the past year). cMet recommendations for colorectal cancer screening and immunization. dCI indicates confidence interval. eIllinois data are not included because the state used a split sample for some preventive services questions. fMedian represents the median value among the 49 states and the District of Columbia.
Appendix Table B. Prevalence of Receipt of Preventive Services for Women Aged 50–64 Years, Behavioral Risk Factor Surveillance System (BRFSS), 2002
Breast Cancer Screeninga
Cervical Cancer Screeningb
Colon Cancer Screeningc
Influenza Vaccinationd
Up-to-Datee
N
%
(95% CI)f
%
(95% CI)
%
(95% CI)
%
(95% CI)
%
(95% CI)
Alabama
499
80.1
(75.9-83.7)
87.1
(81.8-91.0)
48.3
(43.5-53.2)
39.1
(34.6-43.8)
22.0
(18.4-26.2)
Alaska
334
84.7
(77.6-89.8)
88.9
(78.9-94.5)
52.9
(43.4-62.1)
38.1
(29.7-47.3)
22.2
(15.7-30.3)
Arizona
516
81.4
(76.6-85.4)
87.2
(80.8-91.6)
47.3
(40.9-53.7)
41.0
(35.1-47.3)
22.9
(18.3-28.3)
Arkansas
624
69.7
(65.3-73.7)
75.3
(68.9-80.7)
38.0
(33.7-42.5)
40.5
(36.3-44.9)
16.4
(13.5-19.8)
California
542
83.0
(78.6-86.7)
85.4
(79.9-89.6)
47.7
(42.6-52.9)
36.7
(31.9-41.6)
21.0
(17.3-25.3)
Colorado
615
81.2
(77.4-84.4)
89.7
(85.9-92.6)
51.7
(47.2-56.1)
46.3
(41.9-50.7)
27.9
(24.1-32.0)
Connecticut
743
87.2
(83.6-90.1)
91.6
(88.4-94.0)
59.1
(54.5-63.5)
44.2
(39.8-48.8)
28.6
(24.6-32.9)
Delaware
586
90.7
(87.6-93.1)
94.3
(91.4-96.3)
57.7
(52.3-62.9)
42.5
(37.2-47.8)
27.7
(23.2-32.7)
District of
Columbia
292
86.0
(80.7-90.0)
93.7
(88.5-96.7)
58.0
(50.9-64.7)
35.7
(29.3-42.5)
21.4
(16.4-27.4)
Florida
897
79.3
(75.7-82.5)
89.9
(86.1-92.7)
46.8
(42.8-50.7)
28.0
(24.6-31.6)
15.9
(13.3-18.8)
Georgia
737
80.7
(76.7-84.1)
89.7
(85.9-92.5)
51.4
(47.1-55.7)
34.3
(30.3-38.5)
18.3
(15.1-22.0)
Hawaii
819
74.4
(70.1-78.3)
83.2
(78.7-86.9)
42.9
(38.3-47.5)
38.9
(34.5-43.5)
21.2
(17.6-25.3)
Idaho
662
72.0
(68.0-75.7)
83.1
(78.1-87.1)
39.2
(34.9-43.6)
38.0
(33.9-42.3)
17.6
(14.4-21.2)
Illinoisg
---
---
---
---
---
----
---
---
---
---
----
Indiana
851
79.7
(76.5-82.6)
85.0
(81.2-88.2)
40.6
(36.9-44.5)
40.5
(36.8-44.2)
17.3
(14.7-20.3)
Iowa
526
83.3
(79.3-86.6)
88.3
(83.6-91.7)
49.1
(44.2-53.9)
45.4
(40.6-50.3)
24.9
(20.8-29.4)
Kansas
623
81.6
(78.1-84.6)
88.0
(83.6-91.4)
44.6
(40.4-48.9)
47.3
(43.0-51.6)
23.4
(19.9-27.4)
Kentucky
1170
79.8
(76.4-82.8)
84.9
(80.9-88.2)
47.3
(43.0-51.6)
38.6
(34.6-42.8)
20.0
(16.6-23.8)
Louisiana
765
80.2
(76.9-83.1)
86.7
(82.2-90.2)
39.7
(35.9-43.6)
30.8
(27.4-34.5)
14.7
(12.2-17.6)
Maine
374
86.5
(82.3-89.8)
94.5
(90.8-96.8)
53.4
(47.7-58.9)
50.0
(44.4-55.5)
29.7
(24.7-35.1)
Maryland
654
88.2
(85.0-90.9)
91.9
(86.7-95.2)
55.6
(50.7-60.3)
41.1
(36.5-45.8)
23.7
(19.9-27.8)
Massachusetts
923
88.9
(86.1-91.1)
88.7
(85.3-91.3)
53.2
(49.1-57.3)
42.5
(38.5-46.5)
24.9
(21.6-28.4)
Michigan
870
82.9
(78.4-86.6)
88.3
(84.2-91.4)
54.1
(49.6-58.6)
35.0
(31.1-39.0)
22.4
(19.2-25.9)
Minnesota
599
86.3
(82.9-89.1)
91.4
(88.1-93.8)
58.8
(54.3-63.0)
45.2
(40.8-49.6)
31.5
(27.5-35.9)
Mississippi
637
73.1
(69.0-76.8)
83.8
(77.9-88.4)
38.6
(34.5-42.8)
34.7
(30.9-38.8)
15.8
(13.0-19.0)
Missouri
698
78.9
(74.7-82.6)
83.2
(77.7-87.6)
42.9
(38.0-47.9)
42.3
(37.5-47.3)
21.3
(17.3-25.8)
Montana
570
78.3
(74.0-82.0)
85.2
(80.3-89.0)
46.6
(41.2-52.0)
44.5
(39.3-49.8)
21.1
(17.0-25.7)
Nebraska
551
79.2
(75.1-82.7)
88.4
(84.3-91.5)
43.0
(38.5-47.6)
47.8
(43.3-52.4)
23.6
(19.8-27.9)
Nevada
378
78.7
(72.3-83.9)
89.8
(82.9-94.1)
40.8
(34.1-47.8)
31.2
(25.4-37.6)
11.8
(8.6-16.1)
New Hampshire
703
84.2
(80.9-87.0)
89.1
(85.6-91.9)
49.7
(45.6-53.8)
39.3
(35.4-43.4)
23.3
(20.0-26.9)
New Jersey
847
82.2
(76.6-86.7)
85.4
(78.9-90.1)
44.5
(37.4-51.9)
32.8
(26.5-39.7)
15.2
(10.5-21.5)
New Mexico
728
77.9
(74.2-81.2)
85.2
(81.0-88.6)
37.0
(33.0-41.2)
38.1
(34.1-42.3)
16.8
(13.8-20.2)
New York
600
86.2
(82.8-89.0)
91.0
(87.6-93.6)
50.7
(45.9-55.5)
39.1
(34.6-43.8)
23.6
(19.8-27.8)
North Carolina
978
85.3
(81.5-88.3)
91.8
(87.2-94.9)
57.4
(52.6-62.0)
41.4
(36.9-46.1)
25.3
(21.5-29.6)
North Dakota
387
81.8
(77.3-85.5)
85.4
(80.3-89.3)
45.5
(40.1-51.0)
47.1
(41.7-52.5)
25.9
(21.4-31.0)
Ohio
570
81.5
(77.7-84.8)
86.4
(81.7-90.0)
48.4
(43.7-53.1)
38.0
(33.6-42.7)
20.2
(16.7-24.3)
Oklahoma
1045
74.2
(71.1-77.1)
84.0
(80.3-87.2)
37.4
(34.1-40.7)
43.2
(39.8-46.6)
18.6
(16.2-21.3)
Oregon
478
79.8
(75.4-83.6)
86.9
(82.0-90.5)
45.6
(40.6-50.5)
39.7
(35.0-44.7)
21.3
(17.6-25.6)
Pennsylvania
1875
80.9
(78.4-83.2)
86.3
(83.5-88.6)
43.9
(40.9-46.9)
39.2
(36.4-42.1)
19.5
(17.3-22.0)
Rhode Island
515
90.7
(87.6-93.1)
92.6
(88.9-95.1)
55.3
(50.4-60.1)
43.3
(38.6-48.1)
25.7
(21.7-30.1)
South Carolina
688
79.0
(74.8-82.6)
85.3
(80.1-89.3)
47.5
(42.8-52.3)
39.9
(35.4-44.6)
22.6
(18.7-27.0)
South Dakota
642
83.2
(79.8-86.0)
89.9
(86.5-92.5)
42.2
(38.0-46.5)
49.8
(45.6-54.0)
22.7
(19.2-26.7)
Tennessee
474
78.6
(74.1-82.5)
83.1
(77.3-87.6)
49.3
(44.3-54.3)
43.9
(39.1-48.9)
23.3
(19.4-27.7)
Texas
799
77.9
(74.5-81.0)
85.2
(81.0-88.6)
42.6
(38.6-46.7)
42.0
(38.0-46.1)
19.4
(16.5-22.6)
Utah
456
79.0
(74.0-83.2)
85.6
(78.9-90.4)
41.5
(35.7-47.6)
47.1
(41.2-53.1)
22.8
(18.0-28.5)
Vermont
592
83.4
(79.7-86.6)
89.1
(85.5-91.9)
53.4
(49.0-57.8)
39.1
(35.0-43.4)
24.6
(21.0-28.6)
Virginia
633
78.2
(72.9-82.6)
87.1
(81.6-91.1)
45.1
(39.8-50.6)
38.4
(33.5-43.7)
21.4
(17.3-26.1)
Washington
694
80.4
(76.5-83.7)
91.0
(87.5-93.6)
55.4
(50.9-59.9)
40.1
(35.8-44.5)
24.5
(20.8-28.6)
West Virginia
512
81.6
(77.6-85.0)
86.6
(81.9-90.2)
36.6
(32.1-41.3)
40.0
(35.4-44.7)
17.1
(13.8-21.0)
Wisconsin
590
84.3
(80.6-87.4)
88.2
(84.1-91.4)
51.7
(46.9-56.3)
40.2
(35.7-44.8)
23.1
(19.4-27.3)
Wyoming
528
74.8
(70.6-78.6)
85.6
(80.9-89.4)
33.9
(29.7-38.4)
40.5
(36.1-45.1)
16.3
(13.2-20.0)
Lowest
69.7
75.3
33.9
28.0
11.8
Highest
90.7
94.5
59.1
50.0
31.5
Medianh
81.0
87.1
47.3
40.1
22.1
aMet breast cancer screening recommendations (mammogram in past 2 years). bMet cervical cancer screening recommendations (Pap test in the past 3 years, unless the respondent had a hysterectomy and a Pap test was not needed). cMet colorectal cancer screening recommendations (either fecal occult blood testing [FOBT] in the past year or endoscopy [colonoscopy or sigmoidoscopy] within the past 10 years). dMet recommendation for influenza vaccination (influenza vaccination
in the past year). eUp-to-date on preventive services: met screening recommendations for breast cancer, cervical cancer (or if the respondent had a hysterectomy and cervical cancer screening was not recommended), colorectal cancer, and vaccination. fCI indicates confidence interval. gIllinois data are not included because the state used a split sample for some preventive services questions. hMedian represents the median value among the 49 states and the District of Columbia.
Appendix
Table C. Prevalence of Receipt of Preventive Services for Men Aged 65 Years and
Older,
Behavioral Risk Factor Surveillance System (BRFSS), 2002
Colon Cancer Screeninga
Influenza Vaccinationb
Pneumococcal Vaccinationc
Up-to-Dated
N
%
(95% CI)e
%
(95% CI)
%
(95% CI)
%
(95% CI)
Alabama
206
59.6
(52.1-66.7)
64.6
(57.3-71.3)
57.5
(50.0-64.6)
34.7
(27.9-42.2)
Alaska
127
72.9
(61.4-82.0)
63.5
(49.3-75.7)
47.5
(33.9-61.5)
25.8
(16.3-38.4)
Arizona
331
77.5
(71.2-82.8)
72.2
(65.2-78.3)
64.8
(57.6-71.4)
48.8
(41.3-56.3)
Arkansas
321
57.1
(51.1-63.0)
70.2
(64.5-75.4)
58.2
(52.3-63.9)
38.2
(32.5-44.2)
California
277
73.0
(65.9-79.1)
69.8
(63.3-75.7)
59.9
(52.8-66.6)
45.7
(38.6-53.0)
Colorado
234
68.7
(61.9-74.9)
76.7
(70.2-82.2)
66.4
(59.5-72.8)
48.3
(41.2-55.4)
Connecticut
392
74.6
(69.1-79.5)
70.9
(65.4-75.8)
59.8
(54.0-65.4)
44.3
(38.5-50.3)
Delaware
348
73.1
(66.3-79.0)
70.8
(63.0-77.6)
58.3
(50.7-65.5)
38.8
(32.3-45.7)
District of Columbia
146
78.0
(68.4-85.3)
63.9
(54.2-72.6)
43.4
(34.0-53.4)
34.5
(25.8-44.4)
Florida
600
66.5
(61.9-70.8)
60.5
(56.0-64.8)
57.8
(53.3-62.2)
36.6
(32.4-41.1)
Georgia
290
64.9
(58.0-71.2)
60.3
(53.7-66.6)
56.5
(49.5-63.2)
33.0
(27.1-39.5)
Hawaii
485
49.3
(43.6-55.0)
74.1
(68.9-78.7)
53.3
(47.6-59.0)
33.8
(28.5-39.6)
Idaho
388
54.6
(48.9-60.2)
65.4
(59.9-70.6)
56.2
(50.5-61.7)
34.2
(28.9-39.8)
Illinoisf
---
---
---
---
---
---
---
---
---
Indiana
388
53.5
(47.9-58.9)
68.0
(62.7-72.9)
61.4
(55.9-66.6)
33.3
(28.3-38.8)
Iowa
291
63.2
(56.7-69.2)
73.4
(67.3-78.7)
65.2
(58.6-71.2)
42.0
(35.7-48.6)
Kansas
307
64.5
(58.3-70.3)
72.6
(66.7-77.7)
64.9
(58.4-70.8)
43.2
(37.0-49.5)
Kentucky
506
58.0
(52.1-63.7)
67.9
(62.5-72.8)
56.3
(50.3-62.0)
36.3
(30.6-42.4)
Louisiana
334
57.6
(51.4-63.5)
56.4
(50.4-62.2)
58.5
(52.5-64.2)
31.0
(25.7-36.9)
Maine
161
73.1
(64.6-80.2)
73.2
(65.0-80.1)
67.7
(59.3-75.2)
50.1
(41.5-58.6)
Maryland
289
76.8
(70.3-82.3)
69.7
(62.5-76.1)
59.7
(52.0-67.0)
46.4
(38.8-54.2)
Massachusetts
499
69.0
(63.9-73.7)
70.4
(65.4-75.0)
61.7
(56.4-66.7)
43.8
(38.5-49.2)
Michigan
435
72.1
(66.8-76.8)
66.4
(60.9-71.5)
60.8
(55.2-66.2)
43.4
(37.8-49.1)
Minnesota
305
80.5
(75.3-84.9)
74.2
(68.6-79.1)
67.8
(61.7-73.3)
53.9
(47.7-60.0)
Mississippi
248
55.2
(48.3-62.0)
61.2
(54.4-67.6)
56.2
(49.3-62.9)
28.9
(23.1-35.5)
Missouri
381
52.8
(46.2-59.3)
66.2
(59.7-72.2)
57.3
(50.6-63.6)
31.1
(25.4-37.5)
Montana
311
57.2
(49.8-64.3)
65.4
(58.3-71.9)
62.1
(55.0-68.8)
35.7
(28.9-43.2)
Nebraska
393
53.9
(48.3-59.4)
63.7
(58.2-68.8)
57.9
(52.4-63.2)
32.4
(27.4-37.7)
Nevada
266
60.6
(51.9-68.7)
55.8
(47.0-64.2)
61.7
(52.7-69.9)
32.9
(25.3-41.5)
New Hampshire
331
67.9
(61.9-73.4)
73.0
(67.5-77.8)
62.9
(57.1-68.3)
39.8
(34.0-45.8)
New Jersey
491
64.7
(56.3-72.3)
74.8
(67.2-81.1)
62.7
(53.9-70.8)
39.9
(31.6-48.9)
New Mexico
410
59.4
(53.8-64.7)
67.0
(61.5-72.0)
62.4
(56.9-67.6)
38.6
(33.2-44.3)
New York
289
70.6
(64.2-76.3)
65.7
(59.2-71.7)
64.6
(57.8-70.8)
43.3
(36.7-50.2)
North Carolina
485
61.0
(54.1-67.5)
69.4
(62.8-75.3)
62.6
(55.8-68.9)
40.4
(33.4-47.7)
North Dakota
206
63.8
(56.2-70.7)
78.4
(71.5-84.0)
74.0
(66.6-80.2)
46.5
(39.1-54.2)
Ohio
262
57.3
(50.1-64.1)
68.1
(61.3-74.2)
61.2
(53.9-67.9)
34.1
(27.6-41.3)
Oklahoma
605
54.6
(50.2-58.9)
75.2
(71.4-78.7)
65.4
(61.1-69.4)
38.2
(34.0-42.6)
Oregon
213
63.8
(56.5-70.6)
65.9
(58.9-72.3)
60.5
(53.2-67.4)
34.5
(27.7-41.9)
Pennsylvania
999
64.8
(60.9-68.4)
72.0
(68.5-75.2)
62.4
(58.5-66.1)
40.2
(36.4-44.2)
Rhode Island
273
76.0
(69.8-81.2)
74.4
(68.4-79.6)
62.2
(55.8-68.1)
48.4
(41.9-55.0)
South Carolina
319
64.8
(58.0-71.0)
68.0
(61.4-73.9)
64.4
(57.6-70.8)
42.6
(35.8-49.7)
South Dakota
415
60.0
(54.8-65.1)
74.0
(69.2-78.3)
55.4
(50.0-60.6)
35.2
(30.1-40.6)
Tennessee
249
59.3
(52.3-65.9)
70.2
(63.6-76.1)
59.6
(52.6-66.2)
38.1
(31.5-45.2)
Texas
359
61.0
(55.0-66.5)
58.7
(52.9-64.3)
52.8
(46.9-58.5)
31.9
(26.7-37.5)
Utah
285
57.0
(49.9-63.8)
73.3
(66.7-79.1)
66.3
(59.3-72.7)
41.9
(35.1-48.9)
Vermont
312
74.2
(68.5-79.1)
74.5
(69.1-79.2)
64.7
(58.7-70.2)
49.9
(43.8-56.1)
Virginia
292
64.1
(55.7-71.7)
66.3
(57.9-73.7)
57.9
(49.9-65.4)
33.9
(26.8-41.9)
Washington
324
62.3
(55.9-68.3)
59.4
(53.0-65.6)
58.0
(51.5-64.3)
36.5
(30.7-42.7)
West Virginia
276
57.9
(51.5-64.1)
67.4
(61.0-73.2)
61.3
(54.8-67.4)
35.7
(29.7-42.1)
Wisconsin
282
69.8
(63.3-75.6)
75.7
(69.8-80.8)
68.5
(61.8-74.5)
45.4
(38.6-52.4)
Wyoming
251
51.5
(44.6-58.3)
70.5
(63.5-76.6)
64.6
(57.4-71.1)
33.1
(27.0-39.8)
Lowest
49.3
55.8
43.4
25.8
Highest
80.5
78.4
74.0
53.9
Mediang
63.8
69.5
61.2
38.2
aMet colorectal cancer screening recommendations (either fecal occult blood testing [FOBT] in the past year or endoscopy [colonoscopy or sigmoidoscopy] within the past 10 years). bMet recommendation for influenza vaccination (influenza vaccination in
the past year). cMet recommendation for pneumonia vaccination (ever had pneumonia vaccination). dUp-to-date on preventive services: met colorectal cancer screening recommendations and immunization recommendations. eCI indicates confidence interval. fIllinois data are not included because the state used a split sample for some preventive services questions. gMedian represents the median value among the 49 states and the District of Columbia.
Appendix Table D. Prevalence of Receipt of Preventive Services for Women Aged 65
Years and Older, Behavioral Risk Factor Surveillance System (BRFSS), 2002
Breast Cancer Screeninga
Cervical Cancer Screeningb
Colon Cancer Screeningc
Influenza Vaccinationd
Pneumococcal Vaccinatione
Up-to-Datef
N
%
(95% CI)g
%
(95% CI)
%
(95% CI)
%
(95% CI)
%
(95% CI)
%
(95% CI)
Alabama
482
80.1
(75.7-83.9)
77.1
(70.0-82.9)
54.3
(49.2-59.3)
64.9
(59.9-69.5)
59.1
(54.1-63.9)
29.8
(25.4-34.7)
Alaska
166
76.6
(64.3-85.6)
79.4
(64.6-89.1)
66.0
(55.3-75.4)
74.7
(64.9-82.5)
70.2
(59.1-79.4)
36.8
(25.6-49.7)
Arizona
527
81.0
(76.4-84.9)
83.7
(76.6-89.0)
60.4
(54.1-66.3)
67.8
(61.9-73.2)
70.4
(64.8-75.5)
38.0
(32.0-44.4)
Arkansas
600
68.4
(64.2-72.4)
64.3
(57.6-70.5)
50.8
(46.3-55.3)
68.2
(63.9-72.3)
59.1
(54.6-63.4)
27.2
(23.3-31.4)
California
472
80.7
(74.6-85.6)
82.3
(76.0-87.3)
59.2
(52.8-65.3)
72.8
(66.8-78.0)
71.3
(65.3-76.7)
38.1
(32.3-44.2)
Colorado
432
75.2
(70.2-79.7)
73.9
(67.4-79.4)
62.8
(55.8-69.2)
70.8
(63.7-77.0)
69.4
(62.3-75.7)
34.0
(28.7-39.7)
Connecticut
708
81.9
(78.3-85.0)
76.2
(71.0-80.7)
66.4
(62.1-70.5)
71.8
(67.7-75.6)
67.7
(63.3-71.7)
39.0
(34.7-43.5)
Delaware
575
83.3
(78.9-86.9)
74.8
(68.5-80.3)
65.8
(60.7-70.6)
72.0
(67.1-76.5)
68.4
(63.5-73.0)
37.4
(32.3-42.9)
District of Columbia
259
82.8
(76.0-87.9)
73.7
(64.8-81.0)
73.9
(66.7-80.0)
55.5
(48.0-62.6)
50.6
(43.2-58.0)
31.0
(24.6-38.3)
Florida
957
81.8
(78.7-84.5)
77.0
(72.6-80.9)
67.0
(63.5-70.4)
54.3
(50.6-57.9)
56.8
(53.0-60.4)
32.4
(29.0-36.0)
Georgia
598
77.5
(72.8-81.6)
70.3
(63.1-76.6)
58.3
(53.1-63.3)
58.6
(53.6-63.5)
57.8
(52.8-62.6)
28.1
(23.8-32.8)
Hawaii
764
72.4
(67.5-76.7)
71.3
(64.9-76.9)
55.4
(50.4-60.3)
73.7
(69.4-77.5)
64.5
(59.7-69.0)
34.1
(29.6-38.8)
Idaho
688
70.3
(66.2-74.1)
63.0
(56.5-69.1)
58.1
(53.7-62.5)
64.9
(60.5-69.0)
58.4
(54.0-62.7)
29.5
(25.4-34.0)
Illinoish
---
---
---
---
---
---
---
---
---
---
---
---
---
Indiana
710
72.9
(69.1-76.4)
70.9
(65.6-75.7)
55.0
(50.7-59.2)
65.3
(61.1-69.2)
61.0
(56.8-65.1)
23.2
(19.8-27.0)
Iowa
630
76.7
(72.7-80.2)
75.4
(69.6-80.3)
59.7
(54.8-64.4)
73.5
(69.3-77.3)
66.9
(62.2-71.2)
34.3
(29.8-39.1)
Kansas
586
80.1
(76.4-83.4)
77.6
(72.2-82.2)
56.9
(52.3-61.4)
66.0
(61.6-70.1)
60.2
(55.6-64.6)
28.5
(24.3-33.0)
Kentucky
1315
77.2
(74.0-80.2)
76.4
(71.5-80.7)
57.7
(53.8-61.5)
64.3
(60.7-67.8)
56.8
(53.1-60.5)
26.8
(23.2-30.8)
Louisiana
692
79.6
(75.9-82.9)
74.9
(68.3-80.4)
50.9
(46.5-55.2)
57.9
(53.6-62.0)
54.8
(50.5-59.0)
23.0
(19.7-26.7)
Maine
318
82.8
(77.8-86.8)
80.7
(73.6-86.3)
63.9
(57.8-69.6)
74.2
(68.6-79.1)
66.1
(60.1-71.7)
37.8
(31.9-44.0)
Maryland
478
77.6
(72.1-82.2)
76.4
(69.3-82.2)
68.4
(62.9-73.5)
63.2
(57.4-68.7)
66.0
(60.3-71.3)
33.6
(28.2-39.4)
Massachusetts
908
82.3
(79.0-85.1)
73.4
(68.8-77.6)
65.3
(61.4-69.1)
74.0
(70.3-77.4)
64.6
(60.6-68.3)
37.4
(33.3-41.6)
Michigan
740
79.4
(75.6-82.8)
75.3
(69.9-79.9)
65.1
(60.7-69.3)
68.6
(64.4-72.6)
64.3
(59.9-68.5)
33.2
(29.0-37.6)
Minnesota
640
81.3
(77.8-84.2)
81.5
(77.1-85.3)
74.6
(70.8-78.1)
78.3
(74.7-81.6)
72.2
(68.2-75.8)
46.3
(41.9-50.8)
Mississippi
647
69.5
(65.3-73.3)
61.2
(54.3-67.6)
56.4
(51.9-60.8)
64.2
(59.8-68.4)
60.7
(56.2-65.0)
27.4
(23.5-31.7)
Missouri
761
72.6
(68.0-76.8)
65.4
(58.9-71.3)
57.0
(51.9-62.0)
70.3
(65.3-74.8)
63.2
(58.0-68.1)
29.4
(24.9-34.3)
Montana
537
73.8
(68.5-78.4)
78.7
(71.8-84.3)
63.2
(57.6-68.4)
69.4
(64.0-74.4)
71.2
(65.7-76.1)
39.7
(34.1-45.6)
Nebraska
754
73.9
(70.3-77.1)
71.7
(66.6-76.2)
53.3
(49.2-57.3)
71.4
(67.7-74.9)
63.6
(59.7-67.3)
26.7
(23.0-30.7)
Nevada
337
76.9
(69.2-83.2)
66.7
(55.1-76.6)
60.3
(52.4-67.6)
64.3
(56.7-71.2)
67.7
(59.8-74.6)
34.2
(27.5-41.6)
New Hampshire
562
79.7
(75.5-83.4)
78.3
(72.7-83.0)
64.9
(60.2-69.3)
71.9
(67.6-75.8)
64.4
(59.9-68.7)
34.2
(29.9-38.9)
New Jersey
813
74.8
(69.0-79.9)
70.5
(62.7-77.3)
63.5
(56.9-69.7)
65.4
(58.8-71.4)
63.4
(56.7-69.7)
33.3
(26.8-40.4)
New Mexico
625
71.9
(67.6-75.9)
68.0
(61.7-73.7)
52.0
(47.1-56.8)
66.4
(61.7-70.7)
63.0
(58.4-67.3)
26.7
(22.4-31.6)
New York
532
77.7
(73.2-81.6)
72.4
(66.3-77.7)
62.9
(57.7-67.7)
63.9
(58.9-68.7)
61.1
(55.8-66.0)
28.0
(23.8-32.5)
North Carolina
944
81.1
(77.3-84.4)
79.5
(73.9-84.2)
59.8
(54.9-64.5)
67.3
(62.7-71.7)
63.2
(58.4-67.8)
34.0
(29.5-38.7)
North Dakota
439
78.7
(74.2-82.5)
78.8
(72.6-83.9)
64.1
(58.9-69.0)
70.7
(65.8-75.2)
71.5
(66.7-75.9)
37.7
(32.3-43.4)
Ohio
513
77.1
(72.6-81.1)
73.8
(66.8-79.8)
56.4
(50.3-62.3)
65.7
(59.5-71.4)
65.3
(59.0-71.0)
29.5
(24.7-34.9)
Oklahoma
1,083
68.4
(65.2-71.5)
64.9
(59.7-69.7)
50.9
(47.5-54.3)
70.9
(67.6-73.9)
65.6
(62.2-68.9)
25.7
(22.8-28.8)
Oregon
408
83.0
(78.7-86.5)
73.0
(65.7-79.1)
68.3
(63.1-73.1)
69.6
(64.6-74.2)
68.1
(63.0-72.9)
39.1
(33.8-44.7)
Pennsylvania
1,985
77.0
(74.6-79.3)
68.4
(64.7-71.9)
58.8
(56.0-61.6)
69.6
(66.9-72.1)
64.3
(61.5-67.0)
32.6
(29.9-35.5)
Rhode Island
477
85.8
(82.2-88.8)
74.7
(68.7-80.0)
66.2
(61.2-70.8)
73.2
(68.5-77.4)
71.1
(66.3-75.4)
37.9
(33.1-43.1)
South Carolina
583
80.5
(75.9-84.4)
87.5
(82.3-91.3)
64.1
(58.9-69.0)
70.3
(65.3-74.9)
65.1
(59.9-70.0)
36.1
(31.0-41.5)
South Dakota
775
76.5
(73.0-79.6)
71.8
(66.6-76.5)
54.5
(50.6-58.4)
74.3
(70.5-77.8)
57.6
(53.7-61.5)
26.5
(23.3-30.1)
Tennessee
423
74.3
(69.3-78.7)
71.2
(63.5-77.8)
58.6
(53.3-63.8)
72.6
(67.7-77.0)
62.6
(57.4-67.5)
30.3
(25.5-35.6)
Texas
672
70.6
(66.0-74.8)
70.2
(62.7-76.7)
56.9
(52.1-61.5)
62.6
(57.8-67.2)
59.8
(55.0-64.4)
27.1
(23.2-31.4)
Utah
403
70.8
(64.3-76.5)
61.5
(50.8-71.1)
57.6
(50.9-64.1)
69.3
(62.7-75.2)
63.9
(57.1-70.2)
27.8
(22.2-34.1)
Vermont
509
78.9
(74.9-82.5)
76.5
(71.2-81.1)
65.1
(60.4-69.5)
73.0
(68.6-77.0)
67.4
(62.7-71.7)
35.0
(30.4-39.9)
Virginia
513
76.7
(72.1-80.8)
79.7
(72.7-85.2)
59.5
(54.0-64.7)
64.6
(59.4-69.5)
62.8
(57.5-67.8)
32.5
(27.7-37.8)
Washington
597
76.8
(72.1-80.9)
76.2
(70.0-81.4)
68.8
(64.0-73.3)
69.2
(64.6-73.4)
66.5
(61.4-71.2)
36.4
(31.6-41.6)
West Virginia
570
69.3
(65.0-73.2)
67.5
(61.7-72.8)
48.5
(43.9-53.0)
64.7
(60.2-68.9)
61.1
(56.6-65.4)
24.4
(20.6-28.6)
Wisconsin
565
80.3
(76.3-83.7)
74.6
(68.6-79.7)
66.3
(61.4-70.8)
72.8
(68.3-76.8)
72.0
(67.5-76.0)
38.7
(33.9-43.6)
Wyoming
444
69.0
(64.1-73.5)
67.8
(60.8-74.1)
54.0
(49.0-59.0)
70.7
(66.0-75.1)
71.0
(66.2-75.3)
30.0
(25.5-34.9)
Lowest
68.4
61.2
48.5
54.3
50.6
23.0
Highest
85.8
87.5
74.6
78.3
72.2
46.3
Mediani
77.2
74.2
59.7
69.3
64.4
32.9
aMet breast cancer screening recommendations (mammogram within 2 years). bMet cervical cancer screening recommendations (Pap test in the past 3 years, unless the respondent had a hysterectomy and a Pap test was not needed). cMet colorectal cancer screening recommendations (either fecal occult blood testing [FOBT] in the past year or endoscopy [colonoscopy or sigmoidoscopy] within the past 10 years). dMet influenza recommendation (influenza vaccination in the past year). eMet recommendation for pneumococcal vaccination (ever had pneumonia vaccination). fUp-to-date on preventive services: met screening recommendations for breast cancer, cervical cancer (or if the respondent had a hysterectomy and cervical cancer screening was not recommended), colorectal cancer, and immunizations. gCI indicates confidence interval. hIllinois data are not included because the state used a split sample for some preventive services questions. iMedian represents the median value among the 49 states and the District of Columbia.
The opinions expressed by authors contributing to this
journal do not necessarily reflect the opinions of the U.S. Department of Health
and Human Services, the Public Health Service, the Centers for Disease Control and
Prevention, or the authors’ affiliated institutions. Use of trade names is for
identification only and does not imply endorsement by any of the groups named
above.