Differences in Health and Health Behaviors Between State Employees and Other Employed Adults, Oregon, 2007
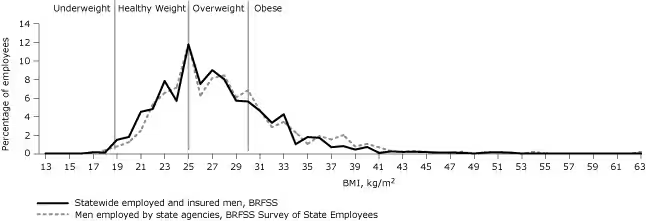
Figure 1. Proportion of employed, insured men statewide and men employed by state agencies who were classified by body mass index (BMI) as underweight, healthy weight, overweight, and obese, Oregon, 2007. Statewide data are from the Behavioral Risk Factor Surveillance System (BRFSS) for Oregon, and data for state agency employees are from the BRFSS Survey of State Employees. The range for healthy weight is BMI 18.5-24.9 kg/m2, and the range for overweight is BMI 25.0-29.9 kg/m2. Reported BMIs ranged from 17 to 63 kg/m2. The distribution of BMI was similar for both groups. The largest proportion of men, 12%, had a BMI of 25 kg/m2. Approximately 1% had a BMI of 18.5 kg/m2. Approximately 6% of employed, insured men statewide and 7% of men employed by state agencies had a BMI of 30 kg/m2, the lower limit for the obese range. |
|
|
|
|
|
|
|