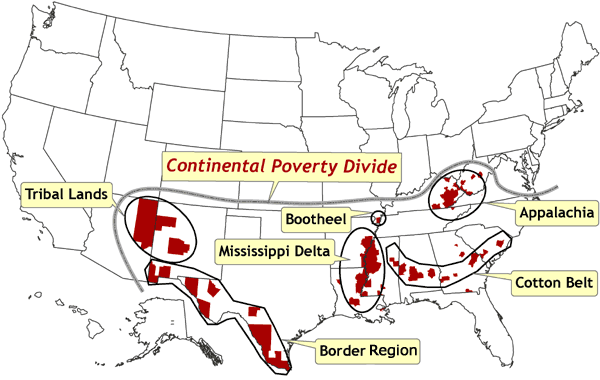
Figure 6. Location of counties that represent spatial clusters in which poverty rates are at least two standard deviations higher than the national mean. These counties correspond with areas that have been defined for other historical, geographic, economic, and cultural reasons (e.g., Appalachia, Mississippi Delta). The continental poverty divide is defined as the distinctive north–south divide across most of the United States, in which concentrations of low poverty and spatial outliers of high poverty are confined to the northern half, and concentrations of high poverty and spatial outliers of low poverty are confined to the southern half. Data source: Community Health Status Indicators (1).
![]()
Volume 4: No. 4, October 2007