At a glance
While HIV affects all people in the United States, Hispanic/Latino people are especially affected. Poverty, migration patterns, educational level, and language barriers may make it harder for some Hispanic/Latino people to seek and receive high-quality health care, including HIV testing, treatment, and other prevention and care services. Addressing these issues and other social and structural barriers can help improve health outcomes for Hispanic/Latino people.

Fast facts
HIV Incidence
HIV incidence refers to the estimated number of new HIV infections in a given year.
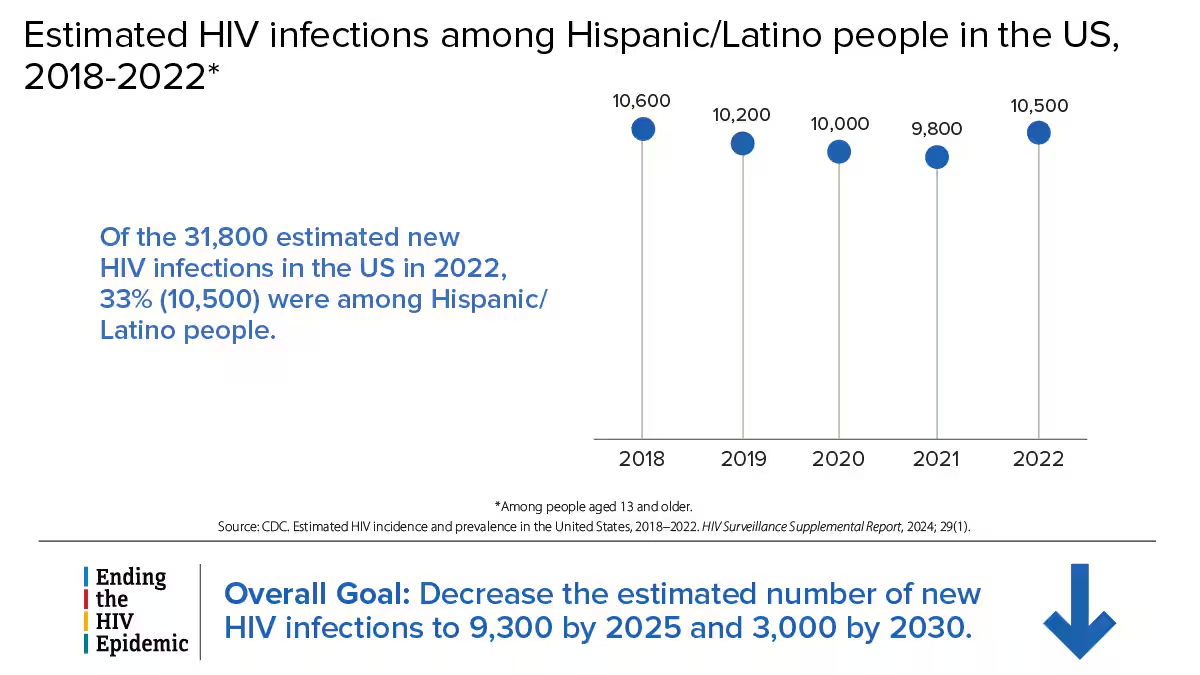
Estimated HIV infections among Hispanic/Latino people in the US, 2018-2022*
10,600 (2018) 10,200 (2019) 10,000 (2020) 9,800 (2021) 10,500 (2022)
Of the 31,800 estimated new HIV infections in the US in 2022, 33% (10,500) were among Hispanic/Latino people.
*Among people aged 13 and older.
Source: CDC. Estimated HIV incidence and prevalence in the United States, 2018–2022. HIV Surveillance Supplemental Report, 2024; 29(1).
Ending the HIV Epidemic Overall Goal: Decrease the estimated number of new HIV infections to 9,300 by 2025 and 3,000 by 2030.
HIV Diagnoses
HIV diagnoses refers to the number of people who received an HIV diagnosis during a given year.

HIV diagnoses among Hispanic/Latino people in the US and 6 territories and freely associated states, 2022
Hispanic/Latino people accounted for 32% (12,167) of the 37,981 people who received an HIV diagnosis in the US and 6 territories and freely associated states in 2022.*
*Among people aged 13 and older.
Source: CDC. Diagnoses, deaths, and prevalence of HIV in the United States and 6 territories and freely associated states, 2022. HIV Surveillance Report, 2024;35. The six territories and freely associated states include American Samoa, Guam, the Northern Mariana Islands, Puerto Rico, the Republic of Palau, and the U.S. Virgin Islands.
Ending the HIV Epidemic Overall Goal: Decrease the number of new HIV diagnoses to 9,588 by 2025 and 3,000 by 2030.
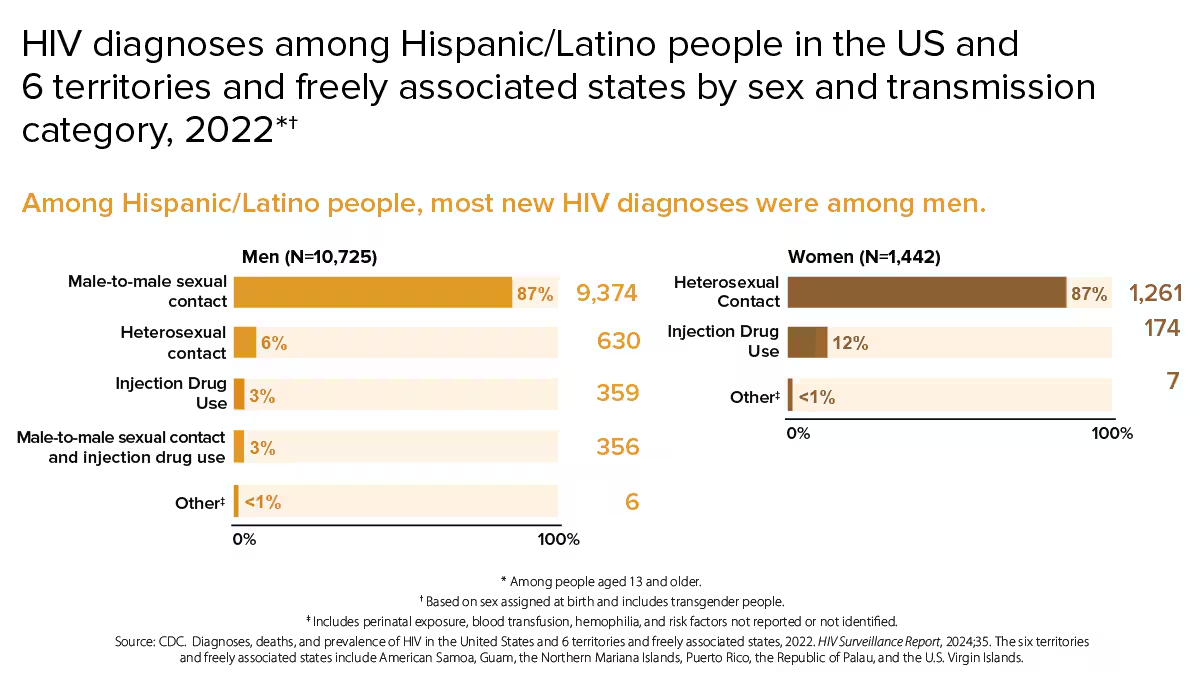
HIV diagnoses among Hispanic/Latino people in the US and 6 territories and freely associated states by sex and transmission category, 2022*†
Among Hispanic/Latino people, most new HIV diagnoses were among men.
Men (N=10,725)
- Male-to-male sexual contact: 87% (9,374)
- Heterosexual contact: 6% (630)
- Injection Drug Use: 3% (359)
- Male-to-male sexual contact and injection drug use: 3% (356)
- Other‡: <1% (6)
Women (N=1,442)
- Heterosexual Contact: 87% (1,261)
- Injection Drug Use: 12% (174)
- Other‡: <1% (7)
*Among people aged 13 and older. †Based on sex assigned at birth and includes transgender people. ‡Includes perinatal exposure, blood transfusion, hemophilia, and risk factors not reported or not identified.
Source: CDC. Diagnoses, deaths, and prevalence of HIV in the United States and 6 territories and freely associated states, 2022. HIV Surveillance Report, 2024:35. The six territories and freely associated states include American Samoa, Guam, the Northern Mariana Islands, Puerto Rico, the Republic of Palau, and the U.S. Virgin Islands.
From 2018 to 2022, HIV diagnoses increased 17% among Hispanic/Latino people overall. Although HIV diagnoses remained stable among young Hispanic/Latino people aged 13 to 24, those aged 45 to 54, and those aged 65 and older, more work is needed to reduce HIV diagnoses among all age groups.
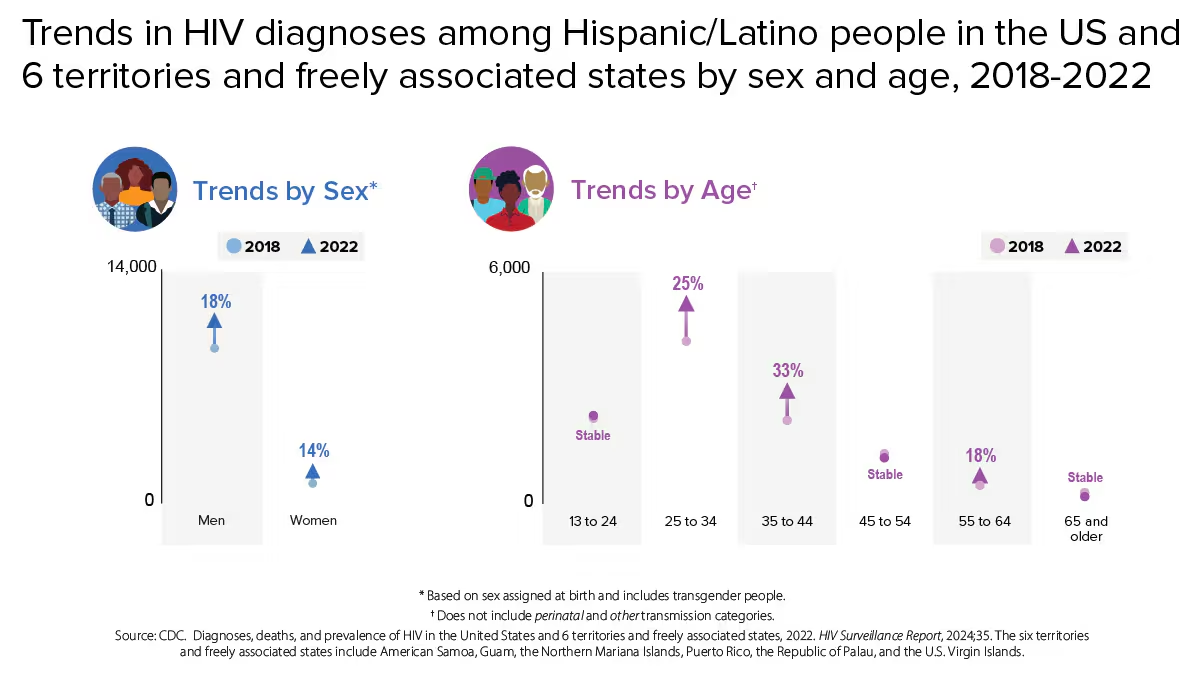
Trends in HIV diagnoses among Hispanic/Latino people in the US and 6 territories and freely associated states by sex and age, 2018-2022
Trends by Sex* 2018 (circle), 2022 (triangle)
- Men: 18% increase
- Women: 14% increase
Trends by Age† 2018 (circle), 2022 (triangle)
- 13 to 24: Stable
- 25 to 34: 25% increase
- 35 to 44: 33% increase
- 45 to 54: Stable
- 55 to 64: 18% increase
- 65 and older: Stable
Based on sex assigned at birth and includes transgender people.
† Does not include perinatal and other transmission categories.
Source: CDC. Diagnoses, deaths, and prevalence of HIV in the United States and 6 territories and freely associated states, 2022. HIV Surveillance Report, 2024;35. The six territories and freely associated states include American Samoa, Guam, the Northern Mariana Islands, Puerto Rico, the Republic of Palau, and the U.S. Virgin Islands.
Knowledge of Status
Knowledge of status refers to the estimated percentage of people with HIV who have received an HIV diagnosis.
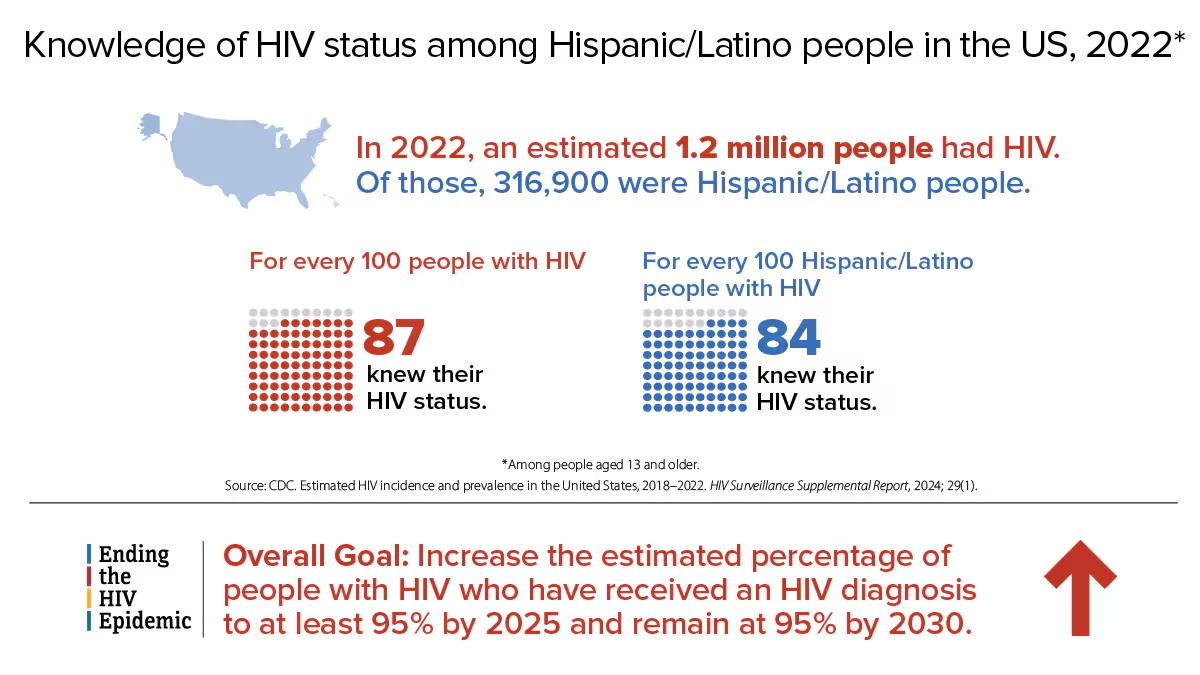
Knowledge of HIV status among Hispanic/Latino people in the US, 2022*
In 2022, an estimated 1.2 million people had HIV. Of those, 316,900 were Hispanic/Latino people.
For every 100 people with HIV, 87 knew their HIV status. For every 100 Hispanic/Latino people with HIV, 84 knew their HIV status.
Overall Ending the HIV Epidemic Goal: Increase the estimated percentage of people with HIV who have received an HIV diagnosis to at least 95% by 2025 and remain at 95% by 2030.
*Among people aged 13 and older. Source: CDC. Estimated HIV incidence and prevalence in the United States, 2018–2022. HIV Surveillance Supplemental Report, 2024; 29(1).
Viral suppression and barriers to care
Viral suppression refers to the percentage of people with diagnosed HIV who have less than 200 copies of HIV per milliliter of blood.
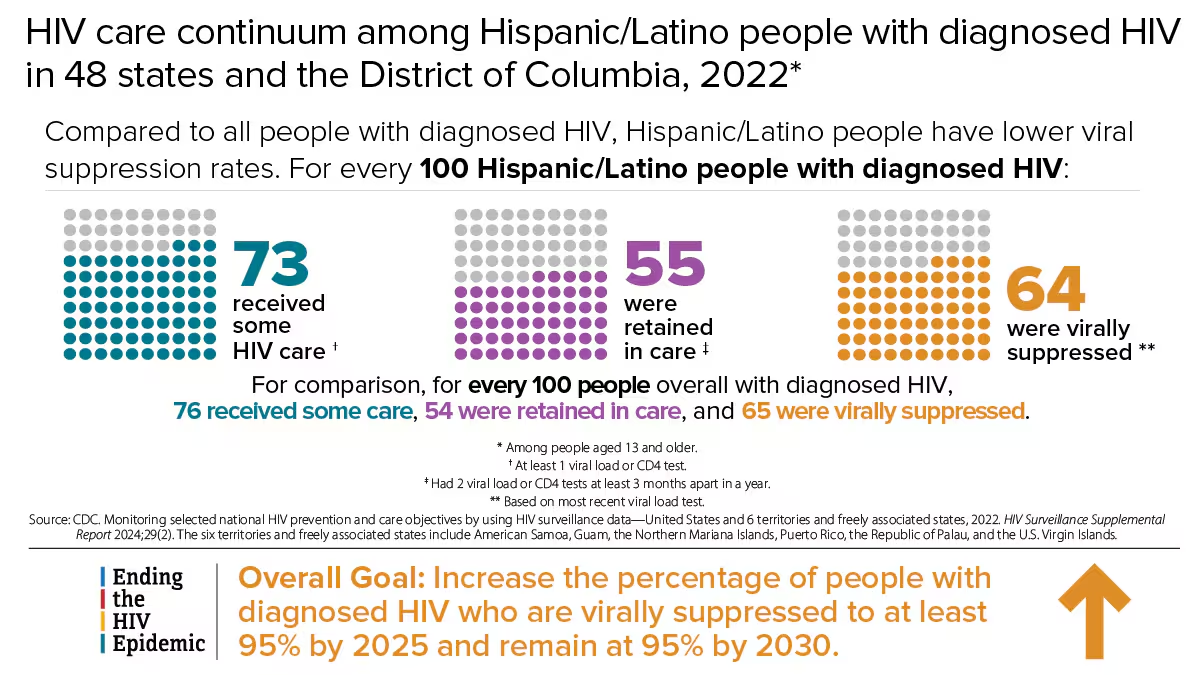
HIV care continuum among Hispanic/Latino people with diagnosed HIV in 48 states and the District of Columbia, 2022*
Compared to all people with diagnosed HIV, Hispanic/Latino people have lower viral suppression rates. For every 100 Hispanic/Latino people with diagnosed HIV:
- 73 received some HIV care †
- 55 were retained in care ‡
- 64 were virally suppressed **
For comparison, for every 100 people overall with diagnosed HIV, 76 received some care, 54 were retained in care, and 65 were virally suppressed.
*Among people aged 13 and older. † At least 1 viral load or CD4 test. ‡ Had 2 viral load or CD4 tests at least 3 months apart in a year. ** Based on most recent viral load test.
Source: CDC. Monitoring selected national HIV prevention and care objectives by using HIV surveillance data—United States and 6 territories and freely associated states, 2022. HIV Surveillance Supplemental Report 2024;29(2). The six territories and freely associated states include American Samoa, Guam, the Northern Mariana Islands, Puerto Rico, the Republic of Palau, and the U.S. Virgin Islands.
Overall Ending the HIV Epidemic Goal: Increase the percentage of people with diagnosed HIV who are virally suppressed to at least 95% by 2025 and remain at 95% by 2030.
Many people with HIV experience challenges with achieving and maintaining viral suppression over time. Some of these challenges include missing HIV medical appointments, needing but not receiving other important health care services, or missing doses of HIV treatment.
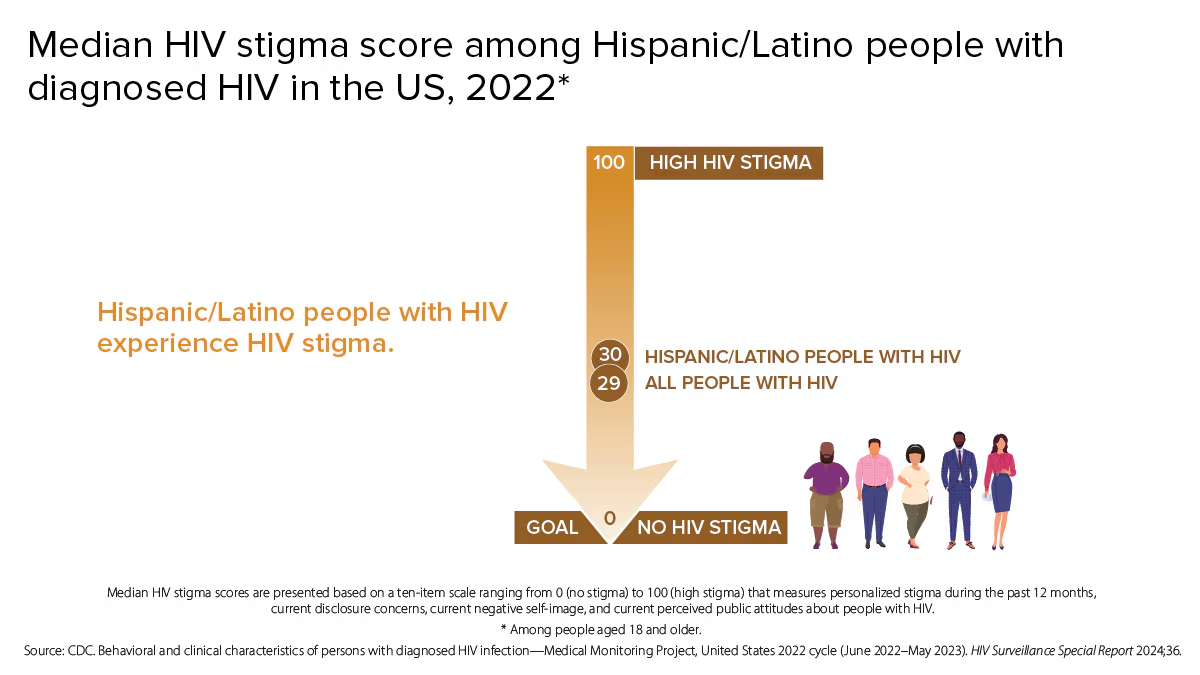
Median HIV stigma score among Hispanic/Latino people with diagnosed HIV in the US, 2022*
Hispanic/Latino people with HIV experience HIV stigma.
HIGH HIV STIGMA 100 29 Hispanic/Latino people with HIV 30 All people with HIV
GOAL 0 NO HIV STIGMA
Median HIV stigma scores are presented based on a ten-item scale ranging from 0 (no stigma) to 100 (high stigma) that measures personalized stigma during the past 12 months, current disclosure concerns, current negative self-image, and current perceived public attitudes about people with HIV.
*Among people aged 18 and older.
Source: CDC: Behavioral and clinical characteristics of persons with diagnosed HIV infection—Medical Monitoring Project, United States 2022 cycle (June 2022–May 2023). HIV Surveillance Special Report 2024;36.

Self-rated health among Hispanic/Latino people with diagnosed HIV in the US, 2022*
People who rate their overall health as good or better may experience better HIV-related outcomes, like adherence to treatment and viral suppression.
70% of all people with HIV rated their overall health as good or better†
69% of Hispanic/Latino people with HIV rated their overall health as good or better†
*Among people aged 18 and older. †Good or better self-rated health is defined as rating one's health as good, very good, or excellent (as opposed to poor or fair) at the time of interview. Source: CDC. Behavioral and clinical characteristics of persons with diagnosed HIV infection—Medical Monitoring Project, United States 2022 cycle (June 2022–May 2023). HIV Surveillance Special Report 2024:36.
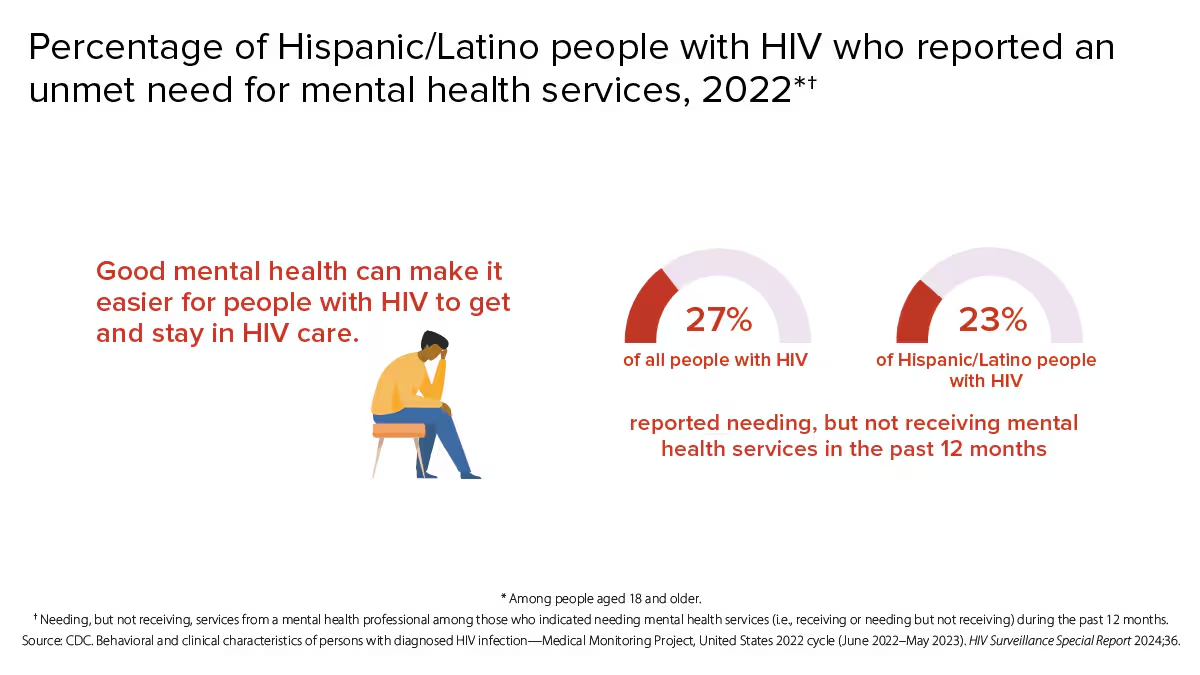
Percentage of Hispanic/Latino people with HIV who reported an unmet need for mental health services, 2022*†
Good mental health can make it easier for people with HIV to get and stay in HIV care.
27% of all people with HIV reported needing, but not receiving mental health services in the past 12 months
23% of Hispanic/Latino people with HIV reported needing, but not receiving mental health services in the past 12 months
*Among people aged 18 and older.
† Needing, but not receiving, services from a mental health professional among those who indicated needing mental health services (i.e., receiving or needing but not receiving) during the past 12 months. Source: CDC. Behavioral and clinical characteristics of persons with diagnosed HIV infection—Medical Monitoring Project, United States 2022 cycle (June 2022–May 2023). HIV Surveillance Special Report 2024,36.

Hunger or food insecurity, unemployment, and unstable housing or homelessness among Hispanic/Latino people with diagnosed HIV in the US, 2022*
Hunger or food insecurity, unemployment, and unstable housing or homelessness can make it difficult for people with HIV to access HIV-related care and maintain viral suppression.
Percentage of people with HIV who reported food insecurity, unemployment, or unstable housing in the past 12 months:
Hispanic/Latino people with HIV:
- 12% Hunger or food insecurity†
- 18% Unemployment‡
- 23% Unstable housing or homelessness**
All people with HIV:
- 11% Hunger or food insecurity†
- 18% Unemployment‡
- 19% Unstable housing or homelessness**
*Among people aged 18 and older. †Going without food due to lack of money during the past 12 months. ‡Those who reported being unemployed at the time of the interview, excluding persons who were unable to work. **Experiencing unstable housing (i.e., moving in with others due to financial issues, moving 2 or more times, or being evicted at any time) or homelessness (living on the street, in a shelter, in a single-room-occupancy hotel, or in a car at any time) during the past 12 months.
Source: CDC. Behavioral and clinical characteristics of persons with diagnosed HIV infection—Medical Monitoring Project, United States 2022 cycle (June 2022–May 2023), HIV Surveillance Special Report 2024;36.
What CDC is doing
CDC works every day to maximize the effectiveness of current HIV prevention interventions and strategies. CDC provides research and guidance on effective interventions to reach people in diverse communities, capacity building assistance for those working in HIV prevention and care services, and many other core components of public health, including data collection and reporting, community and partner engagement, and social marketing campaigns to reach people affected by HIV.
Funding state, territorial, and local health departments is CDC's largest investment in HIV prevention for Hispanic/Latino people. Some key indicators are as follows:
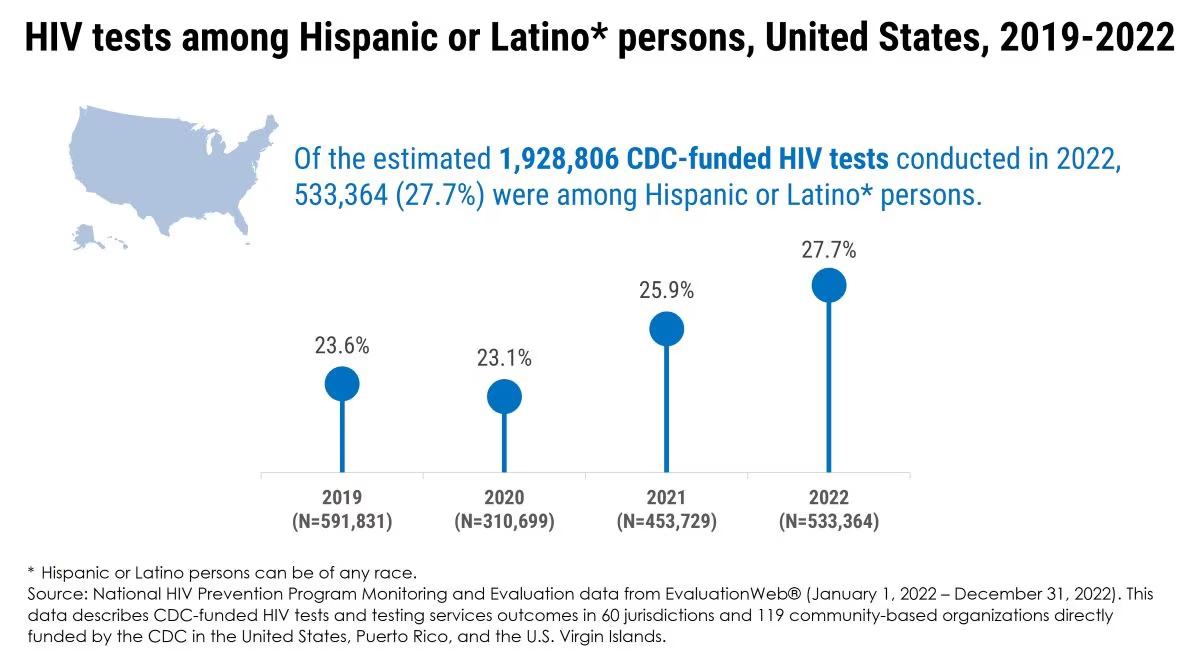
HIV tests among Hispanic or Latino* persons, United States, 2019-2022
Of the estimated 1,928,806 CDC-funded HIV tests conducted in 2022, 533,364 (27.7%) were among Hispanic or Latino* persons.
2019 (N=591,831) - 23.6% 2020 (N=310,699) - 23.1% 2021 (N=453,729) - 25.9% 2022 (N=533,364) - 27.7%
*Hispanic or Latino persons can be of any race. Source: National HIV Prevention Program Monitoring and Evaluation data from EvaluationWeb® (January 1, 2022 – December 31, 2022). This data describes CDC-funded HIV tests and testing services outcomes in 60 jurisdictions and 119 community-based organizations directly funded by the CDC in the United States, Puerto Rico, and the U.S. Virgin Islands.
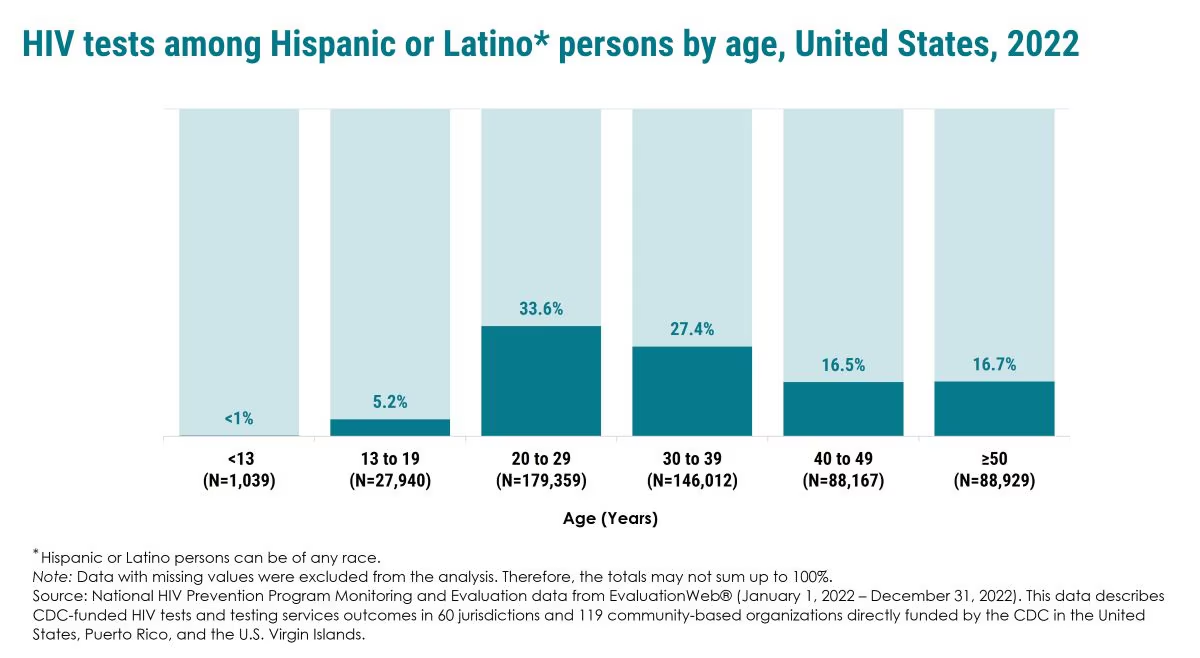
HIV tests among Hispanic or Latino* persons by age, United States, 2022
<13 (N=1,039) - <1% 13 to 19 (N=27,940) - 5.2% 20 to 29 (N=179,359) - 33.6% 30 to 39 (N=146,012) - 27.4% 40 to 49 (N=88,167) - 16.5% ≥50 (N=88,929) - 16.7%
*Hispanic or Latino persons can be of any race. Note: Data with missing values were excluded from the analysis. Therefore, the totals may not sum up to 100%. Source: National HIV Prevention Program Monitoring and Evaluation data from EvaluationWeb® (January 1, 2022 – December 31, 2022). This data describes CDC-funded HIV tests and testing services outcomes in 60 jurisdictions and 119 community-based organizations directly funded by the CDC in the United States, Puerto Rico, and the U.S. Virgin Islands.
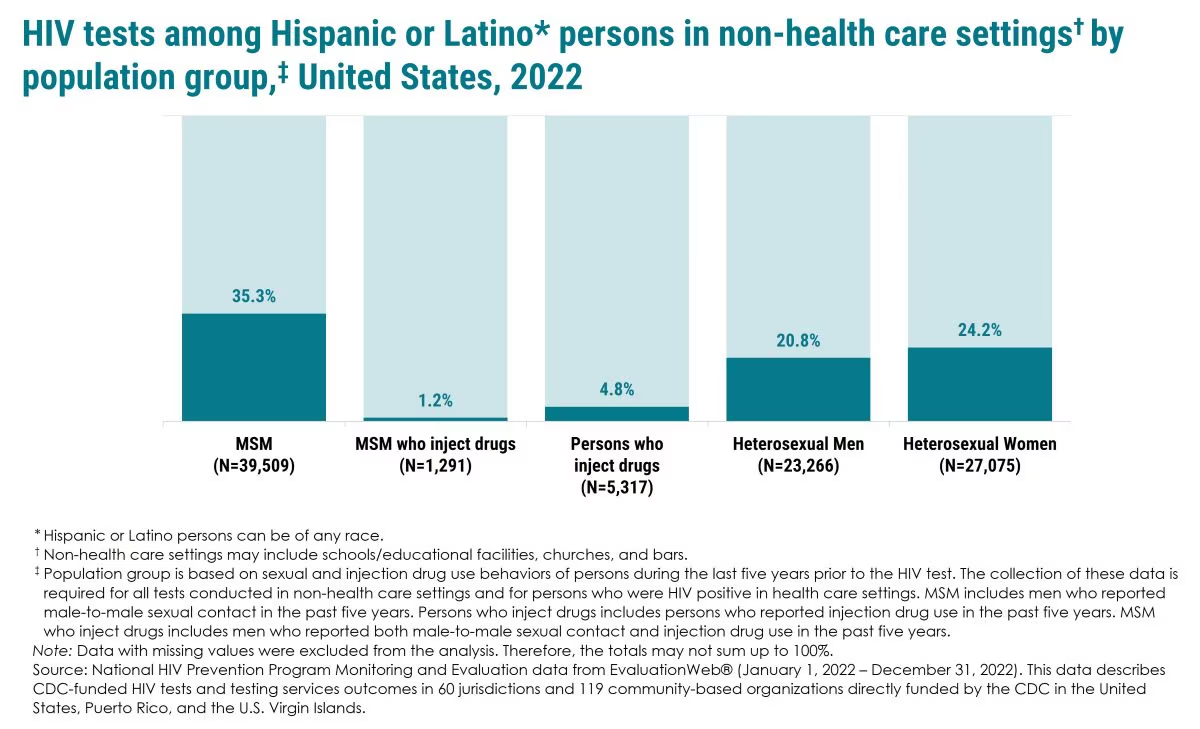
HIV tests among Hispanic or Latino* persons in non-health care settings† by population group,‡ United States, 2022
MSM (N=39,509): 35.3%
MSM who inject drugs (N=1,291): 1.2%
Persons who inject drugs (N=5,317): 4.8%
Heterosexual Men (N=23,266): 20.8%
Heterosexual Women (N=27,075): 24.2%
*Hispanic or Latino persons can be of any race. †Non-health care settings may include schools/educational facilities, churches, and bars. ‡Population group is based on sexual and injection drug use behaviors of persons during the last five years prior to the HIV test. The collection of these data is required for all tests conducted in non-health care settings and for persons who were HIV positive in health care settings. MSM includes men who reported male-to-male sexual contact in the past five years. Persons who inject drugs includes persons who reported injection drug use in the past five years. MSM who inject drugs includes men who reported both male-to-male sexual contact and injection drug use in the past five years.
Note: Data with missing values were excluded from the analysis. Therefore, the totals may not sum up to 100%.
Source: National HIV Prevention Program Monitoring and Evaluation data from EvaluationWeb© (January 1, 2022 – December 31, 2022). This data describes CDC-funded HIV tests and testing services outcomes in 60 jurisdictions and 119 community-based organizations directly funded by the CDC in the United States, Puerto Rico, and the U.S. Virgin Islands.
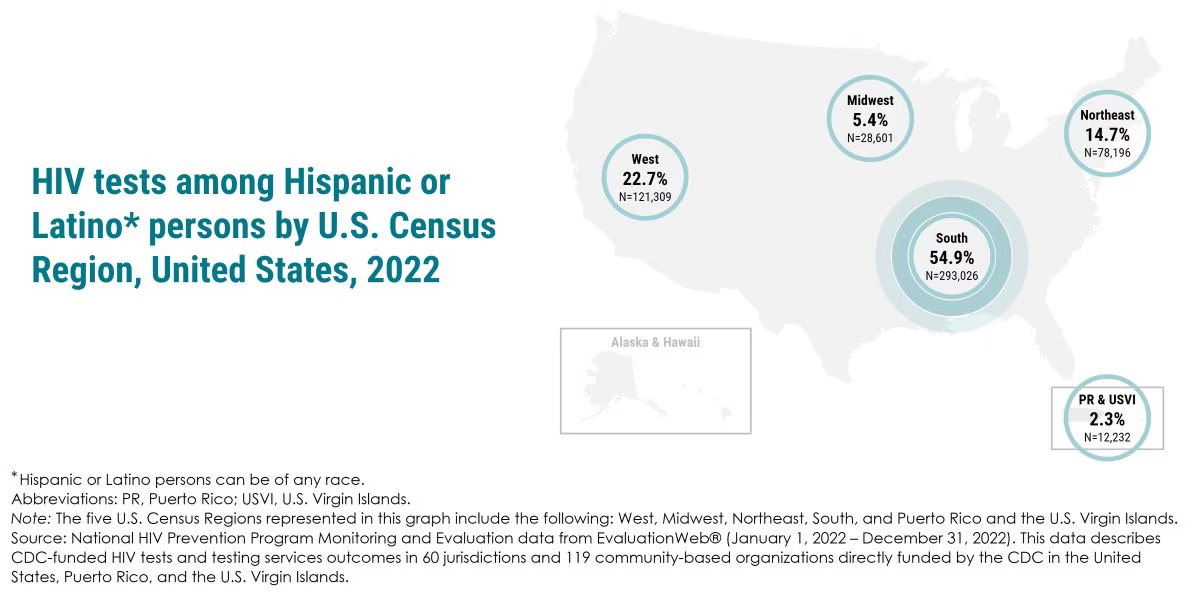
HIV tests among Hispanic or Latino* persons by U.S. Census Region, United States, 2022
West 22.7% N=121,309
Midwest 5.4% N=28,601
Northeast 14.7% N=78,196
South 54.9% N=293,026
PR & USVI 2.3% N=12,232
*Hispanic or Latino persons can be of any race. Abbreviations: PR, Puerto Rico; USVI, U.S. Virgin Islands. Note: The five U.S. Census Regions represented in this graph include the following: West, Midwest, Northeast, South, and Puerto Rico and the U.S. Virgin Islands. Source: National HIV Prevention Program Monitoring and Evaluation data from EvaluationWeb® (January 1, 2022 – December 31, 2022). This data describes CDC-funded HIV tests and testing services outcomes in 60 jurisdictions and 119 community-based organizations directly funded by the CDC in the United States, Puerto Rico, and the U.S. Virgin Islands.
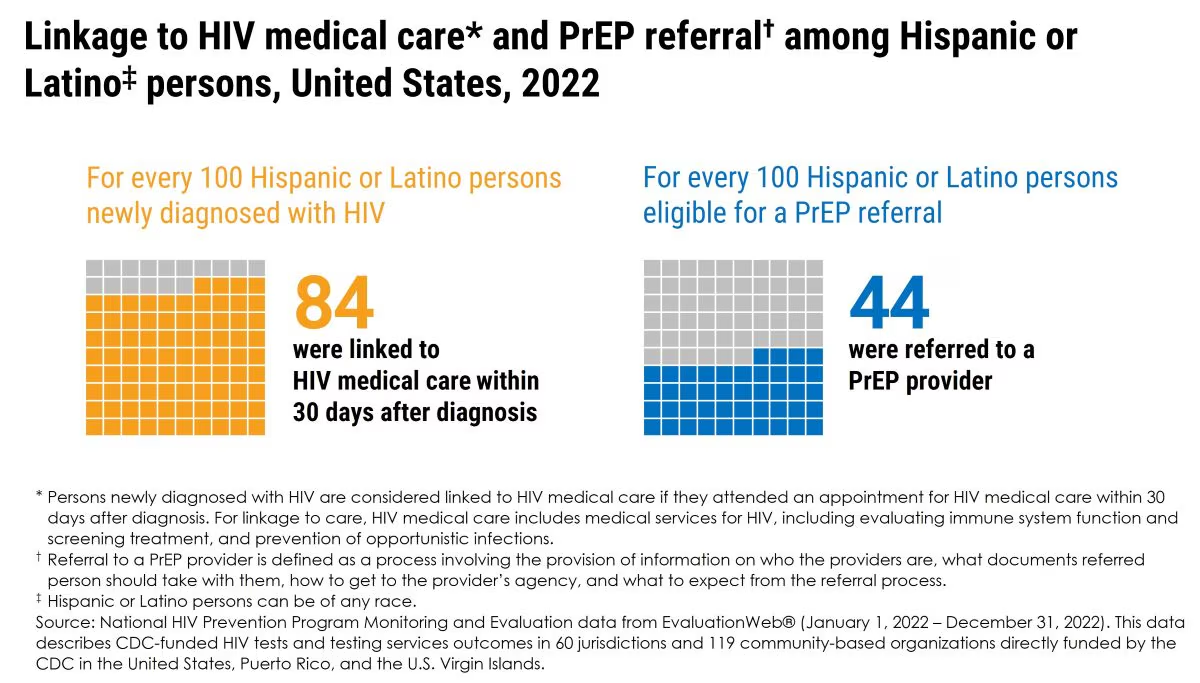
Linkage to HIV medical care* and PrEP referral† among Hispanic or Latino‡ persons, United States, 2022
For every 100 Hispanic or Latino persons newly diagnosed with HIV 84 were linked to HIV medical care within 30 days after diagnosis
For every 100 Hispanic or Latino persons eligible for a PrEP referral 44 were referred to a PrEP provider
*Persons newly diagnosed with HIV are considered linked to HIV medical care if they attended an appointment for HIV medical care within 30 days after diagnosis. For linkage to care, HIV medical care includes medical services for HIV, including evaluating immune system function and screening treatment, and prevention of opportunistic infections.
† Referral to a PrEP provider is defined as a process involving the provision of information on who the providers are, what documents referred person should take with them, how to get to the provider's agency, and what to expect from the referral process.
‡ Hispanic or Latino persons can be of any race.
Source: National HIV Prevention Program Monitoring and Evaluation data from EvaluationWeb® (January 1, 2022 – December 31, 2022). This data describes CDC-funded HIV tests and testing services outcomes in 60 jurisdictions and 119 community-based organizations directly funded by the CDC in the United States, Puerto Rico, and the U.S. Virgin Islands.

Linkage to HIV medical care within 30 days after diagnosis* among Hispanic or Latino† persons newly diagnosed with HIV by age, United States, 2022
NA‡
93.8%
84.0%
86.0%
80.8%
82.0%
Age (Years):
<13
13 to 19 (45/48)
20 to 29 (901/1,073)
30 to 39 (936/1,089)
40 to 49 (328/406)
≥50 (187/228)
*Persons newly diagnosed with HIV are considered linked to HIV medical care if they attended an appointment for HIV medical care within 30 days after diagnosis. For linkage to care, HIV medical care includes medical services for HIV, including evaluating immune system function and screening treatment, and prevention of opportunistic infections. † Hispanic or Latino persons can be of any race. ‡ Indicates no linkage data available for age <13 years.
Note: Data with missing values were excluded from the analysis.
Source: National HIV Prevention Program Monitoring and Evaluation data from EvaluationWeb® (January 1, 2022 – December 31, 2022). This data describes CDC-funded HIV tests and testing services outcomes in 60 jurisdictions and 119 community-based organizations directly funded by the CDC in the United States, Puerto Rico, and the U.S. Virgin Islands.
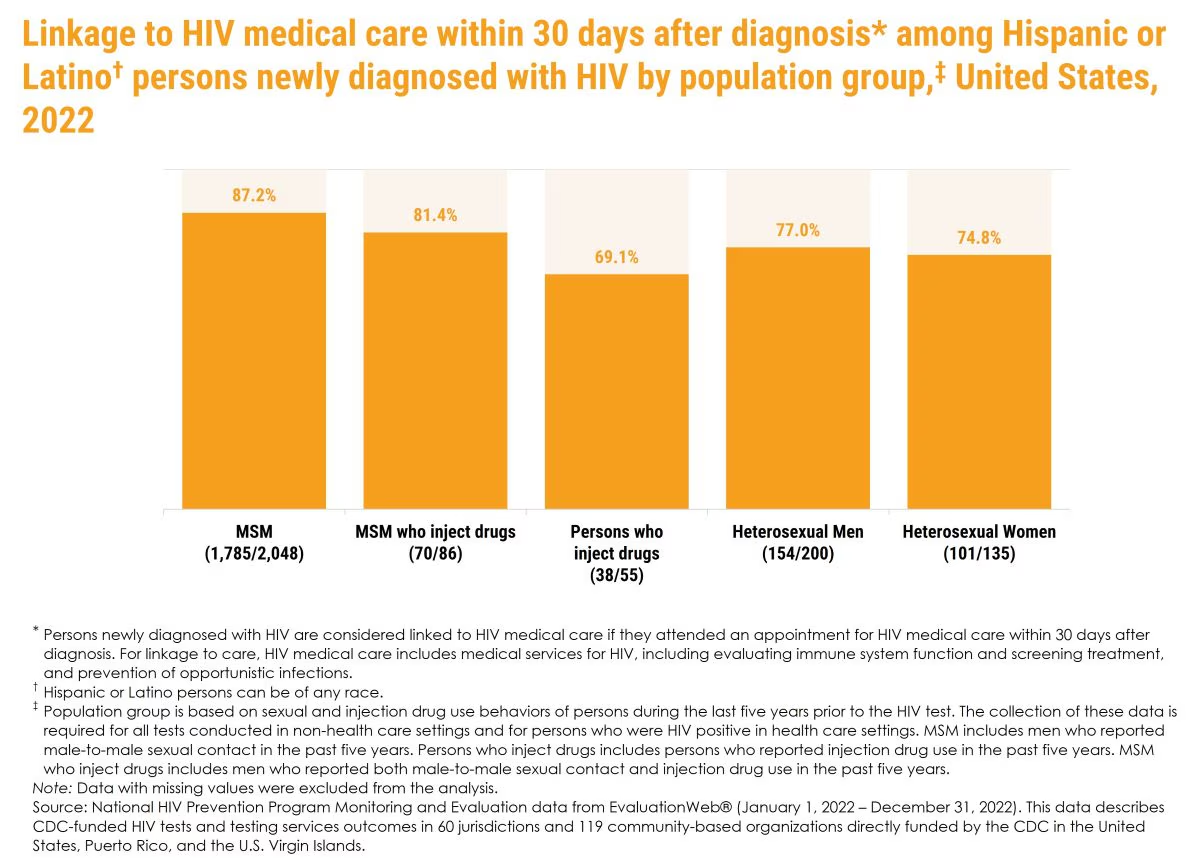
Linkage to HIV medical care within 30 days after diagnosis* among Hispanic or Latino† persons newly diagnosed with HIV by population group,‡ United States, 2022
87.2% MSM (1,785/2,048)
81.4% MSM who inject drugs (70/86)
69.1% Persons who inject drugs (38/55)
77.0% Heterosexual Men (154/200)
74.8% Heterosexual Women (101/135)
*Persons newly diagnosed with HIV are considered linked to HIV medical care if they attended an appointment for HIV medical care within 30 days after diagnosis. For linkage to care, HIV medical care includes medical services for HIV, including evaluating immune system function and screening treatment, and prevention of opportunistic infections. † Hispanic or Latino persons can be of any race. ‡ Population group is based on sexual and injection drug use behaviors of persons during the last five years prior to the HIV test. The collection of these data is required for all tests conducted in non-health care settings and for persons who were HIV positive in health care settings. MSM includes men who reported male-to-male sexual contact in the past five years. Persons who inject drugs includes persons who reported injection drug use in the past five years. MSM who inject drugs includes men who reported both male-to-male sexual contact and injection drug use in the past five years. Note: Data with missing values were excluded from the analysis. Source: National HIV Prevention Program Monitoring and Evaluation data from EvaluationWeb® (January 1, 2022 – December 31, 2022). This data describes CDC-funded HIV tests and testing services outcomes in 60 jurisdictions and 119 community-based organizations directly funded by the CDC in the United States, Puerto Rico, and the U.S. Virgin Islands.
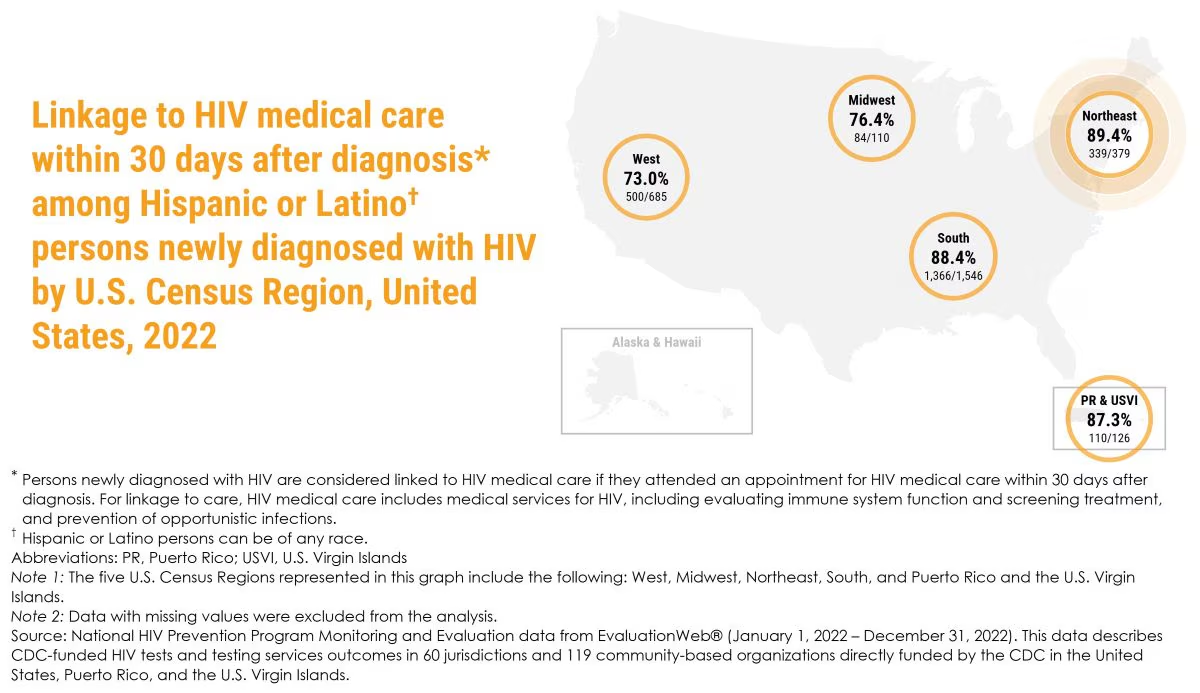
Linkage to HIV medical care within 30 days after diagnosis* among Hispanic or Latino† persons newly diagnosed with HIV by U.S. Census Region, United States, 2022
West 73.0% 500/685
Midwest 76.4% 84/110
Northeast 89.4% 339/379
South 88.4% 1,366/1,546
PR & USVI 87.3% 110/126
*Persons newly diagnosed with HIV are considered linked to HIV medical care if they attended an appointment for HIV medical care within 30 days after diagnosis. For linkage to care, HIV medical care includes medical services for HIV, including evaluating immune system function and screening treatment, and prevention of opportunistic infections.
† Hispanic or Latino persons can be of any race.
Abbreviations: PR, Puerto Rico; USVI, U.S. Virgin Islands
Note 1: The five U.S. Census Regions represented in this graph include the following: West, Midwest, Northeast, South, and Puerto Rico and the U.S. Virgin Islands.
Note 2: Data with missing values were excluded from the analysis.
Source: National HIV Prevention Program Monitoring and Evaluation data from EvaluationWeb® (January 1, 2022 – December 31, 2022). This data describes CDC-funded HIV tests and testing services outcomes in 60 jurisdictions and 119 community-based organizations directly funded by the CDC in the United States, Puerto Rico, and the U.S. Virgin Islands.
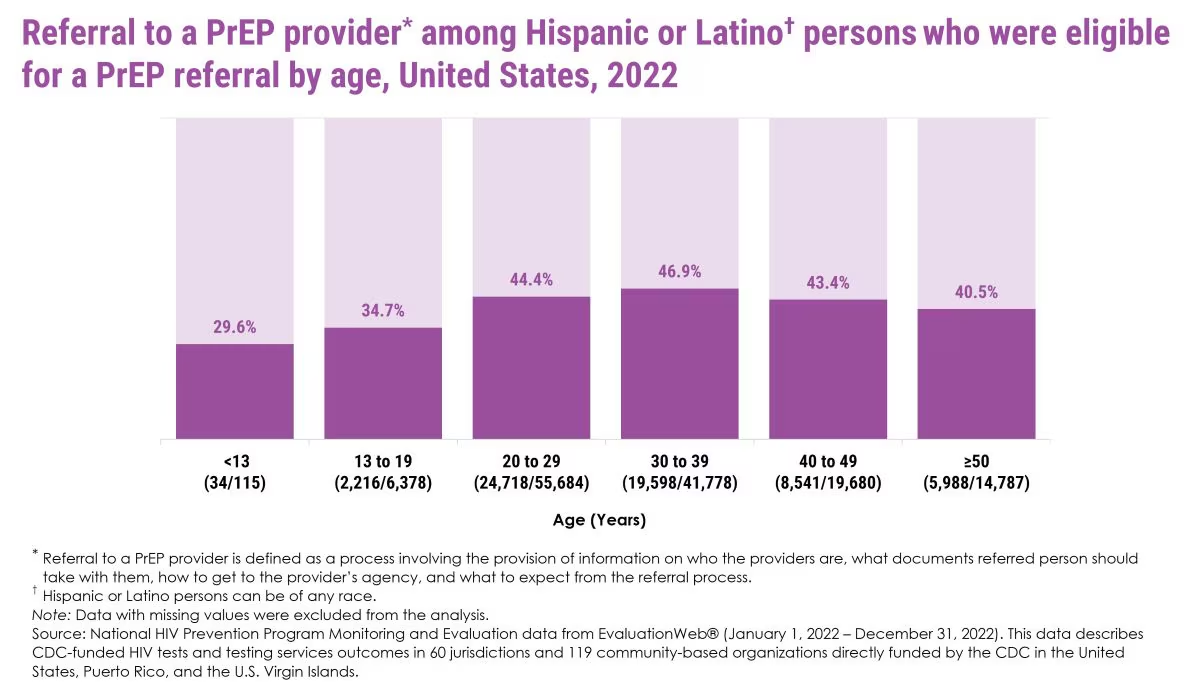
Referral to a PrEP provider* among Hispanic or Latino† persons who were eligible for a PrEP referral by age, United States, 2022
<13 (34/115) 29.6%
13 to 19 (2,216/6,378) 34.7%
20 to 29 (24,718/55,684) 44.4%
30 to 39 (19,598/41,778) 46.9%
40 to 49 (8,541/19,680) 43.4%
≥50 (5,988/14,787) 40.5%
*Referral to a PrEP provider is defined as a process involving the provision of information on who the providers are, what documents referred person should take with them, how to get to the provider's agency, and what to expect from the referral process.
†Hispanic or Latino persons can be of any race.
Note: Data with missing values were excluded from the analysis.
Source: National HIV Prevention Program Monitoring and Evaluation data from EvaluationWeb® (January 1, 2022 – December 31, 2022). This data describes CDC-funded HIV tests and testing services outcomes in 60 jurisdictions and 119 community-based organizations directly funded by the CDC in the United States, Puerto Rico, and the U.S. Virgin Islands.
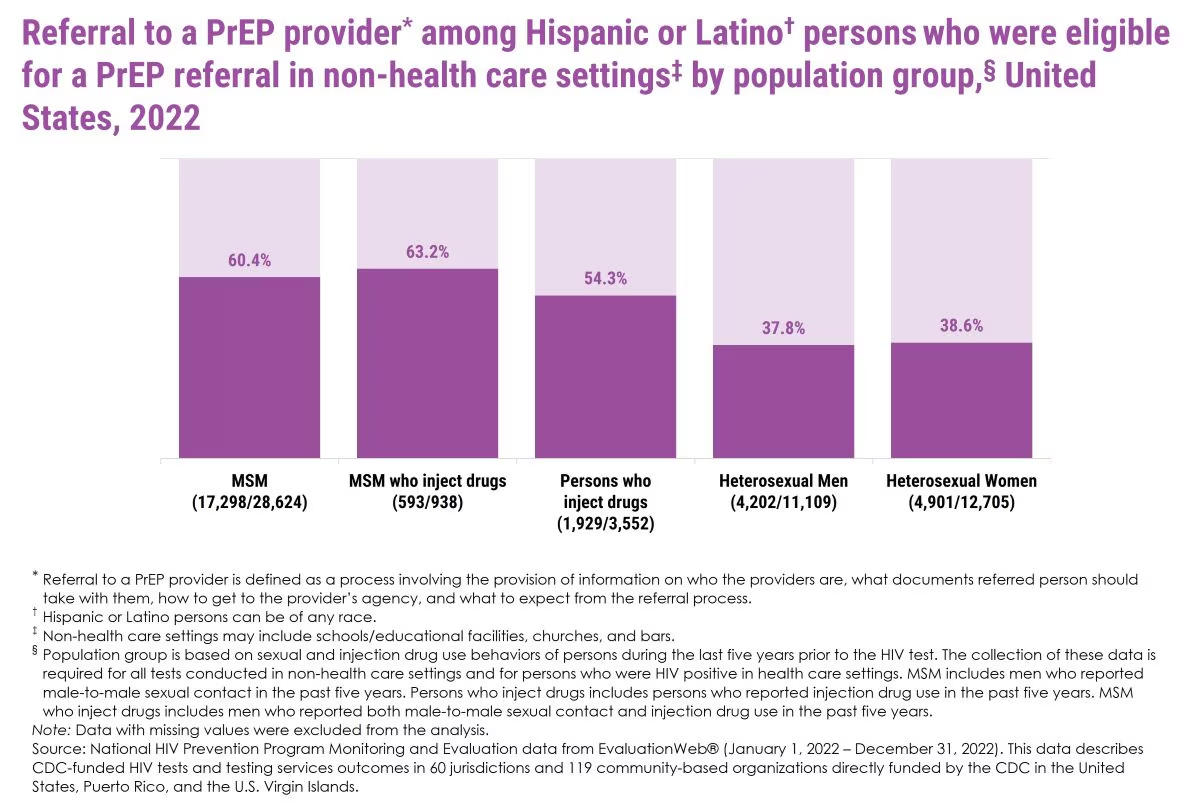
Referral to a PrEP provider* among Hispanic or Latino† persons who were eligible for a PrEP referral in non-health care settings‡ by population group,§ United States, 2022
MSM (17,298/28,624) 60.4%
MSM who inject drugs (593/938) 63.2%
Persons who inject drugs (1,929/3,552) 54.3%
Heterosexual Men (4,202/11,109) 37.8%
Heterosexual Women (4,901/12,705) 38.6%
*Referral to a PrEP provider is defined as a process involving the provision of information on who the providers are, what documents referred person should take with them, how to get to the provider's agency, and what to expect from the referral process. † Hispanic or Latino persons can be of any race. ‡ Non-health care settings may include schools/educational facilities, churches, and bars. § Population group is based on sexual and injection drug use behaviors of persons during the last five years prior to the HIV test. The collection of these data is required for all tests conducted in non-health care settings and for persons who were HIV positive in health care settings. MSM includes men who reported male-to-male sexual contact in the past five years. Persons who inject drugs includes persons who reported injection drug use in the past five years. MSM who inject drugs includes men who reported both male-to-male sexual contact and injection drug use in the past five years.
Note: Data with missing values were excluded from the analysis.
Source: National HIV Prevention Program Monitoring and Evaluation data from EvaluationWeb® (January 1, 2022 – December 31, 2022). This data describes CDC-funded HIV tests and testing services outcomes in 60 jurisdictions and 119 community-based organizations directly funded by the CDC in the United States, Puerto Rico, and the U.S. Virgin Islands.
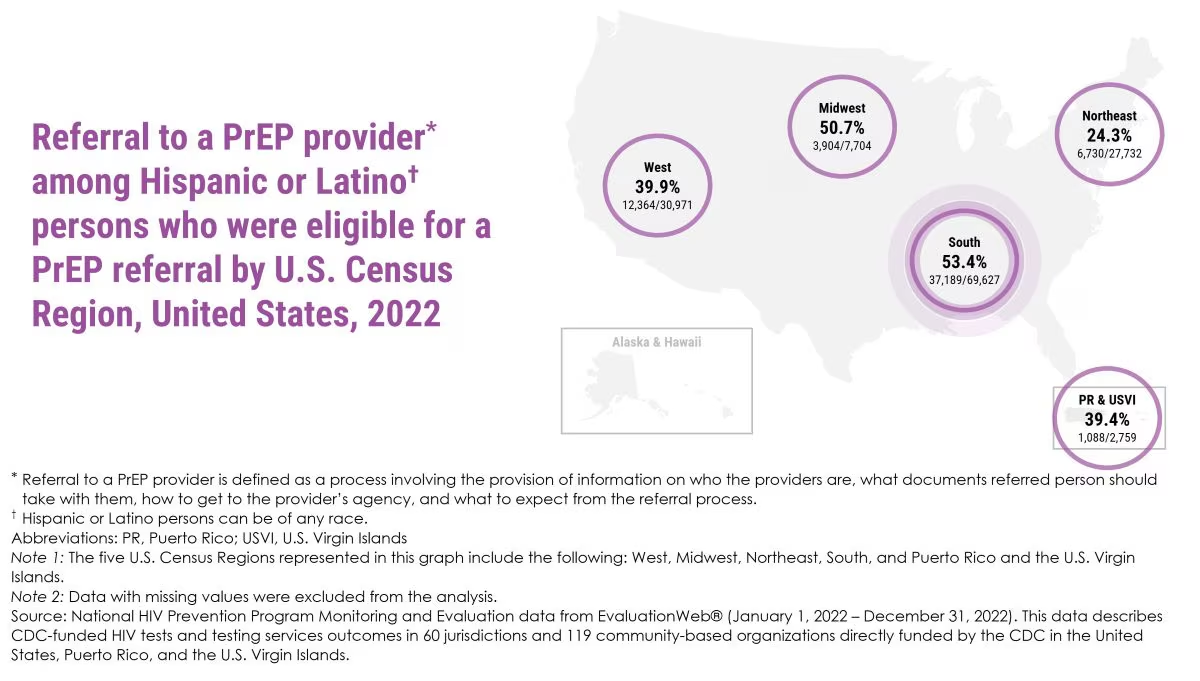
Referral to a PrEP provider* among Hispanic or Latino† persons who were eligible for a PrEP referral by U.S. Census Region, United States, 2022
West: 39.9% (12,364/30,971) Midwest: 50.7% (3,904/7,704) Northeast: 24.3% (6,730/27,732) South: 53.4% (37,189/69,627) PR & USVI: 39.4% (1,088/2,759)
*Referral to a PrEP provider is defined as a process involving the provision of information on who the providers are, what documents referred person should take with them, how to get to the provider's agency, and what to expect from the referral process. † Hispanic or Latino persons can be of any race. Abbreviations: PR, Puerto Rico; USVI, U.S. Virgin Islands Note 1: The five U.S. Census Regions represented in this graph include the following: West, Midwest, Northeast, South, and Puerto Rico and the U.S. Virgin Islands. Note 2: Data with missing values were excluded from the analysis. Source: National HIV Prevention Program Monitoring and Evaluation data from EvaluationWeb® (January 1, 2022 – December 31, 2022). This data describes CDC-funded HIV tests and testing services outcomes in 60 jurisdictions and 119 community-based organizations directly funded by the CDC in the United States, Puerto Rico, and the U.S. Virgin Islands.
- CDC. Estimated HIV incidence and prevalence in the United States, 2018–2022. HIV Surveillance Supplemental Report, 2024; 29(1).
- CDC. Diagnoses, deaths, and prevalence of HIV in the United States and 6 territories and freely associated states, 2022.HIV Surveillance Report, 2024;35.
- CDC. Behavioral and clinical characteristics of persons with diagnosed HIV infection—Medical Monitoring Project, United States 2022 cycle (June 2022–May 2023). HIV Surveillance Special Report 2024;36.
- CDC. Monitoring selected national HIV prevention and care objectives by using HIV surveillance data—United States and 6 territories and freely associated states, 2022. HIV Surveillance Supplemental Report 2024;29(2).
- CDC. National HIV Prevention Program Monitoring and Evaluation data from EvaluationWeb® (January 1, 2022 – December 31, 2022, as of October 1, 2024).
