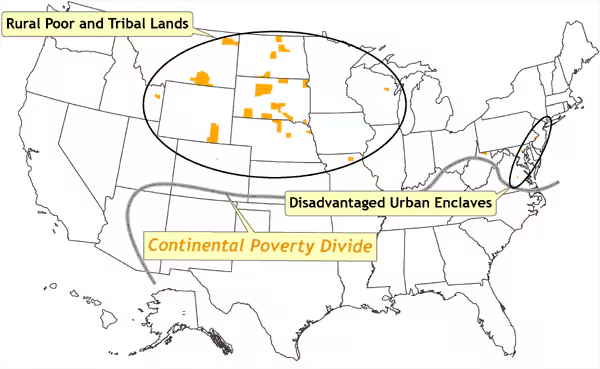
Figure 8. Location of counties in which poverty rates are at least one standard deviation higher than the national mean. These counties are termed spatial outliers because they are surrounded by counties in which the poverty rates are well below the national mean. These areas correspond to a few inner cities in the northeast (termed disadvantaged urban enclaves) such as Baltimore, Philadelphia, Newark, and New York City, and the rural poor and various tribal lands in the upper Great Plains states. The continental poverty divide is defined as the distinctive north–south divide across most of the United States, in which concentrations of low poverty and spatial outliers of high poverty are confined to the northern half, and concentrations of high poverty and spatial outliers of low poverty are confined to the southern half. Data source: Community Health Status Indicators (1).
![]()
Volume 4: No. 4, October 2007